
Tracking email marketing metrics is easy. Tracking the right ones is not. Most guides list dozens of KPIs without explaining which metrics actually matter for growth, retention, or revenue — especially in 2026, when open rates are distorted by Apple’s Mail Privacy Protection and Gmail’s AI summaries.
This guide breaks down key email marketing metrics by goal, so you can learn how to measure email marketing performance, interpret benchmarks correctly, and improve the metrics that drive real business impact.
What are email marketing metrics?
Email marketing metrics are measurable indicators used to evaluate how well your email campaigns perform. These email marketing KPIs help teams understand whether emails are reaching users, how people interact with them, and what results those interactions drive.
Some important email marketing metrics focus on short-term signals, such as opens or clicks, while others reflect business outcomes, such as conversions, revenue, ROI, or retention. Used together, marketing metrics provide a structured way to analyze performance, identify gaps, and improve email campaigns based on real user behavior rather than assumptions.
Email marketing metrics by goal
Not all email marketing metrics serve the same purpose. Some help you understand whether emails reach inboxes, others show how users engage, and only a few reveal real business impact.
Organizing email metrics by goal makes it easier to understand what to measure and why it matters, especially in mobile apps where email is part of a broader lifecycle rather than a standalone channel.
| Goal | Metric | What it tells you | Why it matters |
|---|---|---|---|
| Reach & deliverability | Deliverability rate | Whether emails actually reach inboxes | No opens, clicks, or revenue are possible without inbox placement |
| Bounce rate (hard/soft) | Quality of your email list | Poor list hygiene hurts engagement and sender reputation | |
| Spam complaint rate | User trust + sender reputation | Even small spikes can damage future deliverability | |
| Engagement | Open rate | Who opened your email | Useful for trends, unreliable alone due to MPP and Gmail AI |
| CTR (click-through rate) | Who took action | Strongest indicator of message relevance | |
| CTOR | How content perform after open | Helps diagnose copy and CTA effectiveness | |
| Re-engagement rate | Inactive users returning after email | Critical metric for products & mobile apps | |
| Conversion & revenue | Conversion rate | Clicks → meaningful action | Connects email engagement to real outcomes |
| Revenue per message | Value of each email sent | Enables scaling without oversending | |
| Revenue per user | Monetization impact by segment | Shows lifecycle and segment effectiveness | |
| Email marketing ROI | Revenue vs cost | Final business metric stakeholders care about | |
| List health & retention | Unsubscribe rate | Audience fatigue or mismatch | Signals relevance and frequency issues |
| List growth rate | Whether your email audience is expanding | Indicates long-term channel sustainability |
Now that we’ve grouped email marketing metrics by goal, let’s look at each category more closely and break down how to calculate, interpret correctly, and improve each metric.
Reach & deliverability metrics: Deliverability, bounce & spam rates
Before you evaluate opens, clicks, or revenue, you need to confirm one thing: are your emails actually reaching inboxes? Email deliverability metrics show whether messages were accepted by mail servers, where they land (inbox vs spam), and whether list quality is putting your sender reputation at risk.
For big brands and mobile apps with large audiences, even small deliverability issues can scale into major losses, making these some of the most important email marketing metrics to monitor early.
Deliverability rate
What it shows: The percentage of emails that successfully reach recipients’ inboxes (not spam folders, not bounced).
Why it matters: Deliverability is the foundation of all email performance. Low inbox placement caps your open rate, CTR, and revenue regardless of content quality.
How to calculate:
Deliverability rate = (Emails delivered to inbox / Total emails sent) × 100
Benchmark: Aim for 95%+ deliverability. Anything below 90% signals issues with authentication, list quality, or sender reputation.
Bounce rate
What it shows: The percentage of emails that failed to deliver, split into:
- Hard bounces: Permanent failures (invalid email, domain doesn’t exist)
- Soft bounces: Temporary issues (full inbox, server down)
Why it matters: High bounce rates damage sender reputation and reduce future deliverability. Bounces often indicate outdated user data or poor list hygiene.
How to calculate:
Bounce rate = (Bounced emails / Total emails sent) × 100
Hard bounce rate = (Hard bounces / Total emails sent) × 100
Soft bounce rate = (Soft bounces / Total emails sent) × 100
Benchmark:
- Total bounce rate should stay below 2%
- Hard bounces should be under 0.5%
- Soft bounces can temporarily spike, but shouldn’t persist
Spam complaint rate
What it shows: The percentage of recipients who marked your email as spam.
Why it matters: Spam complaints are one of the strongest negative signals for mailbox providers. Even small spikes can reduce inbox placement for future campaigns, especially for high-volume senders.
Common causes:
- Sending too frequently to unengaged users
- Misaligned opt-in expectations
- Overly promotional or repetitive messaging
How to calculate:
Spam complaint rate = (Spam complaints / Emails delivered) × 100
Benchmark: Keep spam complaints below 0.1% (1 complaint per 1,000 emails). Anything above 0.3% is critical.
Engagement metrics: Open rate, CTR, and CTOR
Email engagement metrics show how users interact with your emails after they are delivered. While opens and clicks don’t directly measure revenue, they’re strong leading indicators of message relevance, timing, and content effectiveness.
For mobile apps, engagement metrics help diagnose lifecycle messaging performance — whether welcome emails drive activation, whether cart abandonment emails re-engage shoppers, and whether retention campaigns keep users coming back.
Email open rate
What it shows: The percentage of delivered emails that recipients opened.
Why it matters & how to interpret it correctly: Open rate reflects whether your subject lines, sender name, and send timing earned user attention. However, open rate should be interpreted carefully. Apple’s Mail Privacy Protection can inflate opens, while Gmail’s AI-generated summaries may reduce them. As a result, open rate alone is no longer a reliable indicator of success.
How to calculate:
Open rate = (Unique opens / Emails delivered) × 100
What a good open rate looks like:
- 20–25% → below average
- 25–35% → solid
- 35–50%+ → strong
- 50%+ → common for triggered or transactional emails
Click-through rate (CTR)
What it shows: The percentage of delivered emails where users clicked a link or CTA.
Why it matters: CTR is the strongest engagement indicator because it measures action, not just attention. A high CTR means users found your message relevant enough to take action. For mobile apps, CTR connects email directly to in-app actions — feature usage, purchases, renewals, and re-engagement.
How to calculate:
Email CTR = (Unique clicks / Emails delivered) × 100
Benchmark: Aim for 2–4% CTR for most email campaigns. Anything consistently below 1% signals weak relevance, poor targeting, or misaligned messaging, while 4%+ typically indicates strong lifecycle targeting or highly contextual emails.
Click-to-open rate (CTOR)
What it shows: The percentage of users who clicked after opening the email.
Why it matters: CTOR isolates content performance. If open rate is healthy but CTR is low, CTOR helps diagnose whether the issue is weak copy, unclear CTAs, layout problems, or message overload. It’s especially useful for A/B testing email content without mixing in deliverability or subject-line effects.
How to calculate:
CTOR = (Unique clicks / Unique opens) × 100
Benchmark: A healthy CTOR typically falls between 15% and 25%. Results under 10% often point to unclear messaging or weak CTAs, while 20–30% and above suggest that the email content strongly resonates with users and effectively guides them toward action.
Re-engagement rate
What it shows: The percentage of inactive email subscribers who return and engage after a win-back campaign.
Why it matters: The re-engagement rate shows whether you can retain users before they churn. For mobile apps, this metric is especially important because reactivating dormant users is often cheaper and faster than acquiring new ones.
How to calculate:
Re-engagement rate = (Users who engaged after win-back / Inactive users targeted) × 100
Benchmark: Re-engagement rates typically range from 5–15%, depending on the length of inactivity and the relevance of the offer.
Run re-engagement email campaigns to win back users who are showing signs of churn (e.g., ‘30 days of inactivity’ or ‘No app open in 7 days’) by offering relevant incentives or rewards to encourage their return.

Conversion & revenue metrics: Conversion rate, revenue per email, and ROI
Conversion and revenue metrics connect email performance to real business outcomes. Unlike engagement KPIs, these ROI metrics show whether emails actually drive subscriptions, purchases, renewals, or other high-value actions.
This group is essential because conversions often happen after the click (sometimes hours or days later), making proper interpretation critical.
Email conversion rate
What it shows: The percentage of email recipients who completed a desired action — subscription start, purchase, feature activation, renewal, etc.
Why it matters: Conversion rate bridges the gap between engagement (opens, clicks) and outcomes (revenue, retention). High CTR without conversions means interest but no follow-through, often due to poor landing page experience or misaligned messaging.
How to calculate:
Conversion rate = (Conversions / Emails delivered) × 100
Benchmark: A conversion rate of 2–3% indicates solid performance for email campaigns. Rates above 10% are rare and typically limited to highly time-sensitive transactional emails, such as renewal or abandoned-cart reminders.
Revenue per email / Revenue per message
What it shows: The average revenue generated per email sent.
Why it matters: Revenue per email reveals the true value of each message, enabling email programs to scale without oversending. For mobile apps with per-message email pricing, this metric directly determines profitability and sustainability.
How to calculate:
Revenue per email = Total revenue attributed to email / Total emails sent
For example, if a campaign generates $15,000 in subscription revenue from 10,000 emails sent, revenue per email is $1.50.
Revenue per user (from email)
What it shows: The average revenue generated per individual user who received at least one email.
Why it matters: Revenue per user shows whether email is effectively monetizing your audience. Unlike revenue per email (which can be optimized by sending less), revenue per user shows lifecycle value contribution — whether email helps users subscribe, purchase more, or renew.
How to calculate:
Revenue per user = Total revenue from email / Number of unique users who received emails
Email marketing ROI
What it shows: How much revenue your email program generates compared to what it costs to run.
Why it matters: ROI is the ultimate business metric. It shows whether email is profitable and how it compares to other channels. For mobile apps, strong email ROI makes email one of the highest-return channels when done well.
How to calculate:
Email marketing ROI = (Revenue − Cost) / Cost
Or as a percentage:
Email marketing ROI (%) = ((Revenue − Cost) / Cost) × 100
📲CLICK USE OUR EMAIL ROI CALCULATOR
Benchmark: A strong email marketing ROI is considered $36 return per $1 spent (3,600% ROI), while top performance can reach up to $70+ return per $1 spent.
List health & retention metrics: Unsubscribe rate, list growth, and re-engagement
List health and retention metrics show how email affects your audience over time. Unlike engagement or revenue metrics, they help identify whether email communication strengthens user relationships or gradually pushes users away. For big brands with large databases, these metrics are critical for sustainable growth.
Unsubscribe rate
What it shows: The percentage of recipients who opted out after receiving an email.
Why it matters: Unsubscribes signal fatigue, relevance mismatch, or over-messaging. A spike in the unsubscribe rate after a campaign indicates something went wrong: poor segmentation, an off-brand tone, too much frequency, or broken expectations.
How to calculate:
Unsubscribe rate = (Unsubscribes / Emails delivered) × 100
Benchmark: Keep your unsubscribe rate below 0.2% to maintain a healthy email program. Anything above 0.5% is a clear signal to review your email marketing strategy.
List growth rate
What it shows: How fast your email list is expanding, accounting for both new subscribers and losses (unsubscribes, bounces).
Why it matters: List growth rate shows whether your email channel is scaling or shrinking. For mobile apps, email list growth should track with app user growth — if your app is growing but your email list isn’t, you’re missing engagement opportunities.
How to calculate:
List growth rate = ((New subscribers − Unsubscribes − Bounces) / Total subscribers) × 100
Benchmark: Positive, steady growth is the goal. Flat or negative growth usually signals acquisition–retention imbalance or low opt-in quality.
How to improve: Optimize opt-in timing — ask for email after a meaningful action (first purchase, feature use, account creation), and offer value at signup (exclusive content, discounts, early access).

How to measure email marketing performance & improve it
Pushwoosh makes tracking email marketing metrics straightforward by surfacing performance data in two key places:
Individual message performance
Every email in the Pushwoosh Customer Journey Builder shows real-time performance metrics directly on the canvas:
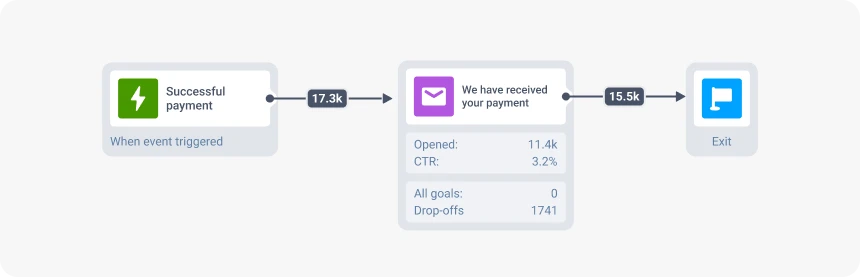
This makes it easy to diagnose issues at the message level and optimize journeys without leaving the workflow.
Campaign-level dashboard analytics
For broader performance tracking, Pushwoosh’s dashboard aggregates metrics across all email campaigns:
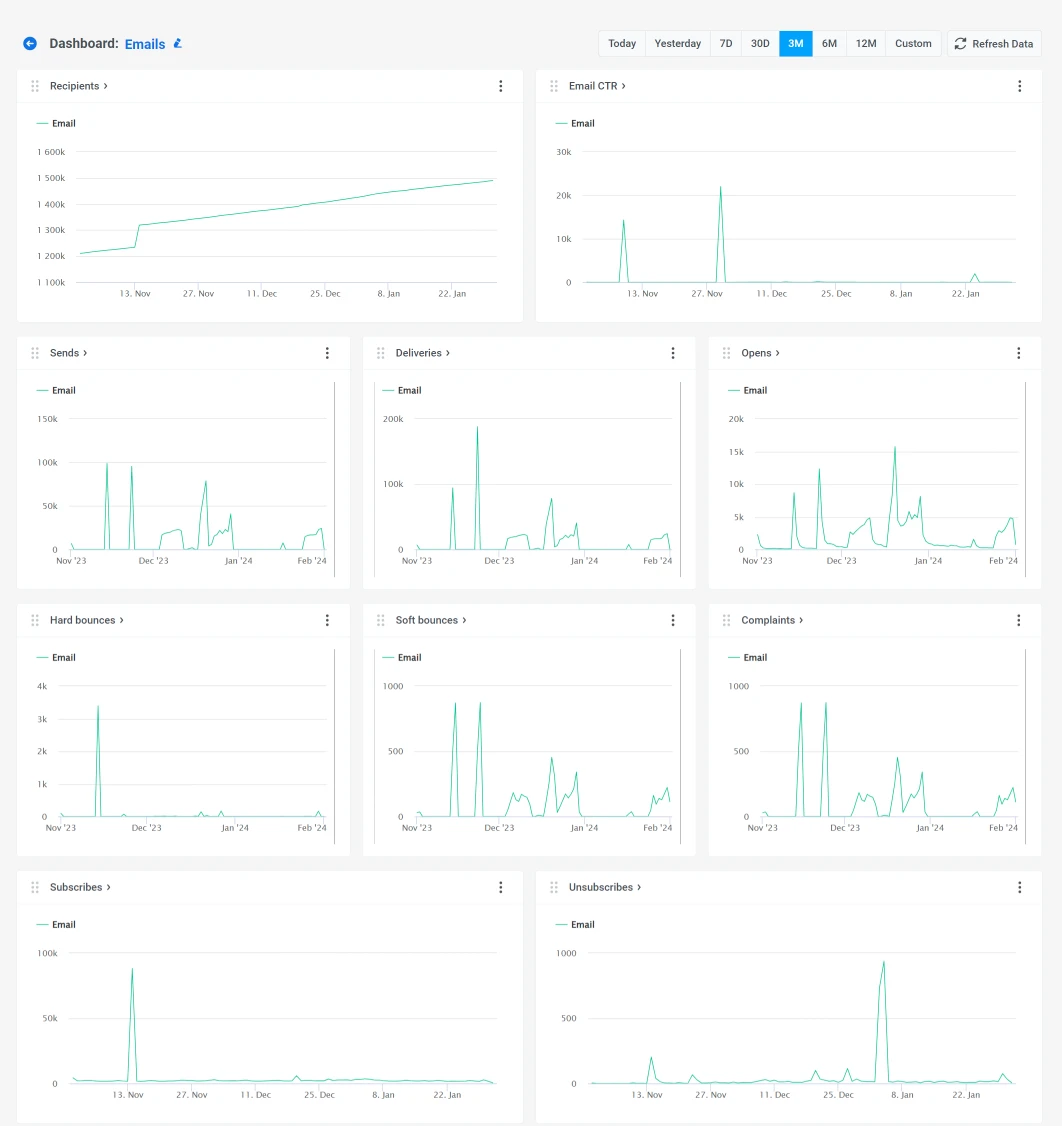
The analytics dashboard lets you compare open rates across messages, analyze trends, and identify opportunities to optimize an email campaign.
A/B/n testing and AI for continuous improvement
Pushwoosh also supports A/B/n testing within email campaigns, letting you test:
- Subject lines
- Send times
- Email copy and CTAs
- Personalization depth
The platform automatically calculates statistical significance and declares winners, so you can optimize based on real user behavior rather than guesswork.
💡 Pro tip: Use AI to generate email content, optimize send times, generate segments, and create email campaigns to significantly improve email marketing metrics and increase ROI without manual work.
Improve email marketing metrics with Pushwoosh
Improving email marketing metrics isn’t about chasing individual KPIs. It’s about understanding how metrics connect across the user lifecycle — from deliverability and engagement to conversion, retention, and ROI.
As an omnichannel customer engagement platform and email automation tool, Pushwoosh helps mobile teams track, analyze, and improve email performance through personalization, behavior-based segmentation, A/B/n testing, and AI optimization, delivering measurable business impact.