How well do mobile apps in your industry perform when it comes to push notifications? Are users opting in? Are they clicking through? And how do engagement patterns change? To answer these questions, we turned to the Pushwoosh Benchmarks Study 2025.
Methodology
We analyzed data from over 600 apps.
Our analysis covers both push notification performance — opt-in rates and click-through rates (CTR) — and overall app usage metrics, including daily active users (DAU) and monthly active users (MAU).
🔖Study period
- Push notification CTR benchmarks: Q4 2024–Q2 2025
- Push notification opt-in rate, DAU, and MAU: Q1 2024–Q4 2024
🔖Industries
We looked at apps across 20+ industries. In this post, we focus on seven key app categories: e-commerce & retail, fintech, action games, hypercasual games, media & entertainment, and news.
Each industry’s results are compared to the all-industries average to show where apps are leading or lagging — and where there’s room to grow.
🔖Calculation methodology
Push CTR is the ratio of push opens to push recipients, as calculated in Pushwoosh.
The average CTR was calculated as a weighted arithmetic average, where campaigns with a larger number of recipients carried greater weight in the calculation.
Certain push types were excluded to avoid skewing the results:
-
Silent pushes, which are delivered in the background and register zero opens;
-
Transactional pushes, whose CTRs can achieve extreme values.
As a result, our approach provides CTR benchmarks that apps can rely on for typical broadcast or segmented campaigns.
Push opt-in rate is the percentage of users who have enabled push notifications out of all app users.
DAU and MAU represent the share of unique users who opened the app at least once in the past 24 hours or past month, respectively. They are expressed as percentages so you can compare your app’s engagement regardless of the size of your user base.
E-commerce & Retail
Push notification metrics
Opt-in
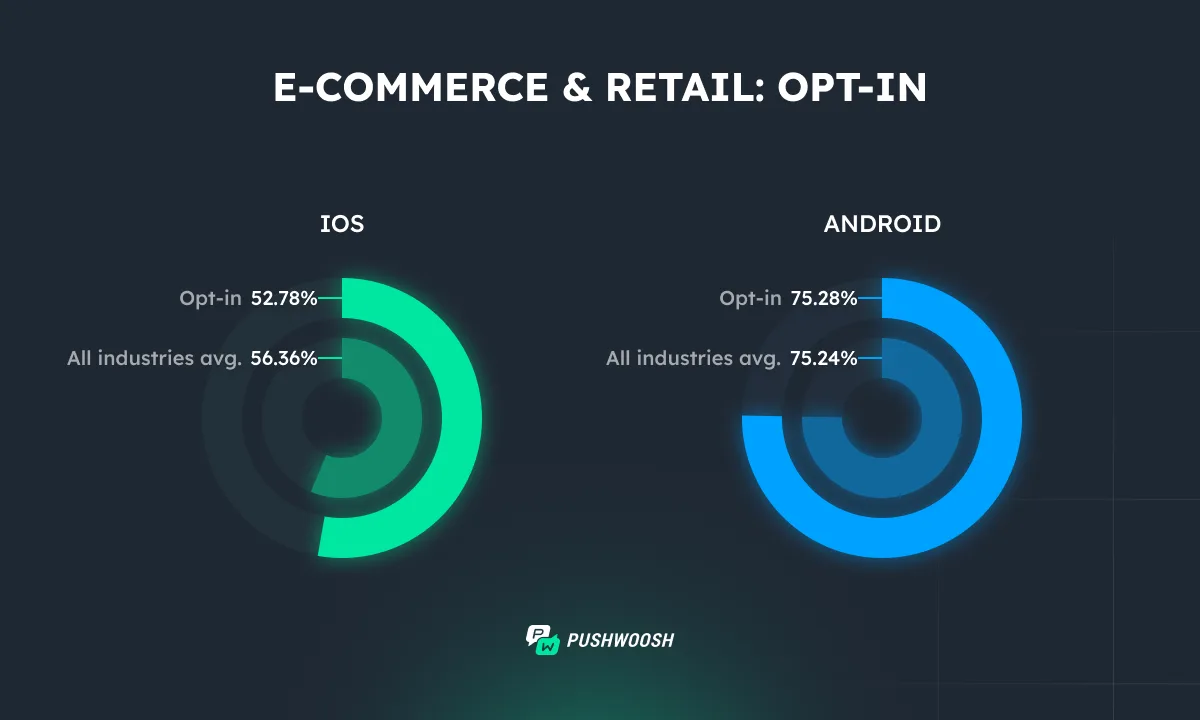
Only slightly more than half of iOS users subscribe to push notifications in E-commerce & Retail. And they are less inclined to subscribe to push notifications compared to the average across all industries.
On Android, opt-in rates are significantly higher than on iOS and are roughly in line with the overall benchmark.
CTR
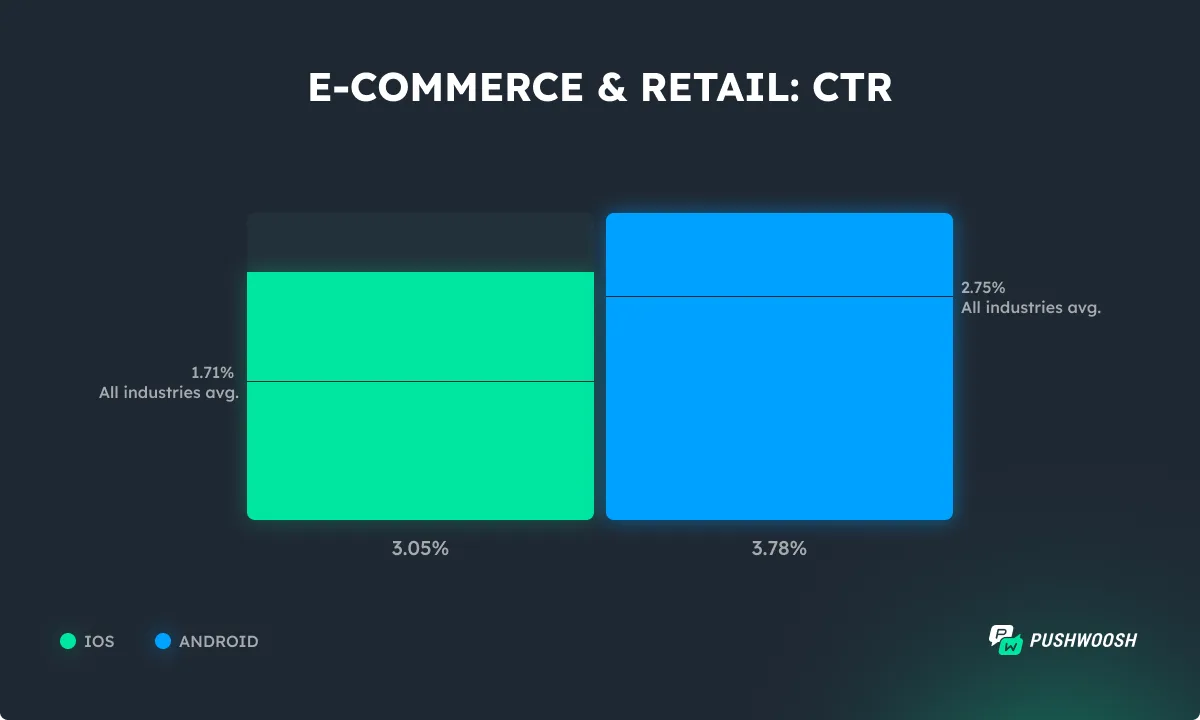
In e-commerce & retail, Android users engage with push notifications more than iOS users, showing a CTR of 3.78% compared to iOS’s 3.05%. Both platforms exceed the all-industries averages.
App performance metrics
DAU
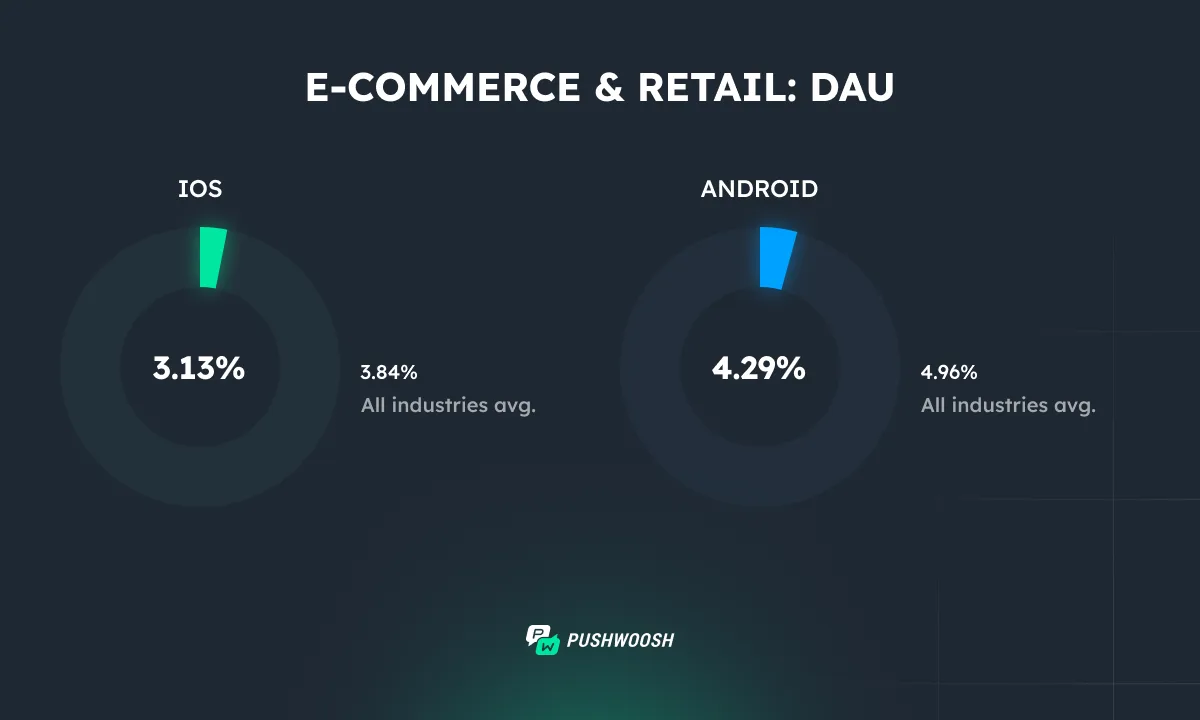
Daily engagement is modest, which is consistent with the trend across industries: on both iOS and Android, the metric is close to the overall benchmark.
MAU
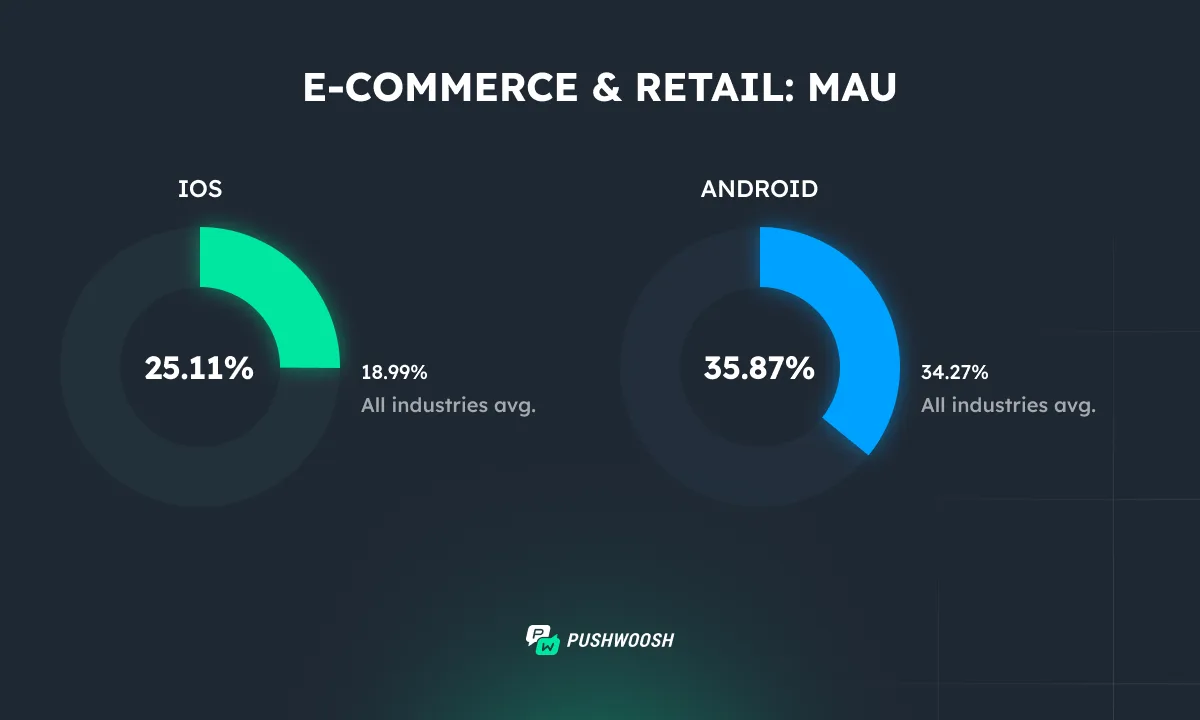
However, monthly engagement tells a different story—users tend to return regularly over longer periods, with both iOS and Android users exceeding the all-industries average.
💡Action point: Focus less on daily activation and more on lifecycle messaging that supports episodic but consistent app usage, such as seasonal offers or monthly campaigns.
Fintech
Push notification metrics
Opt-in
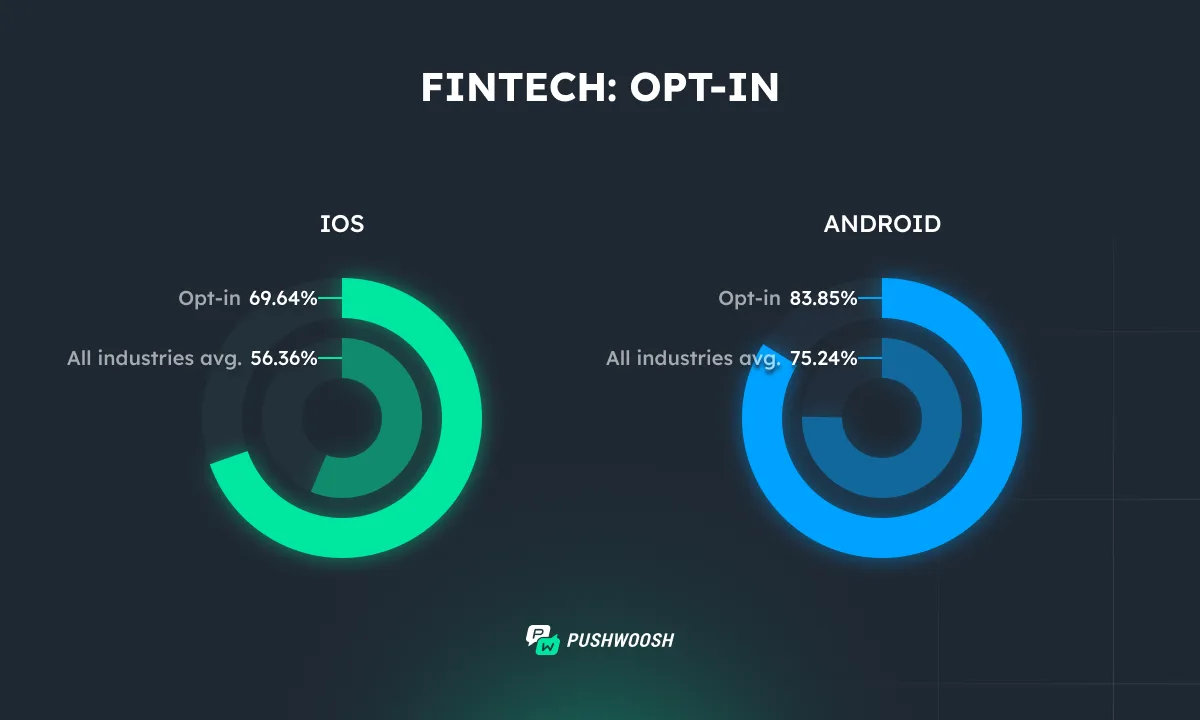
Fintech apps show strong opt-in rates across both platforms, with Android achieving a record-high result.
CTR
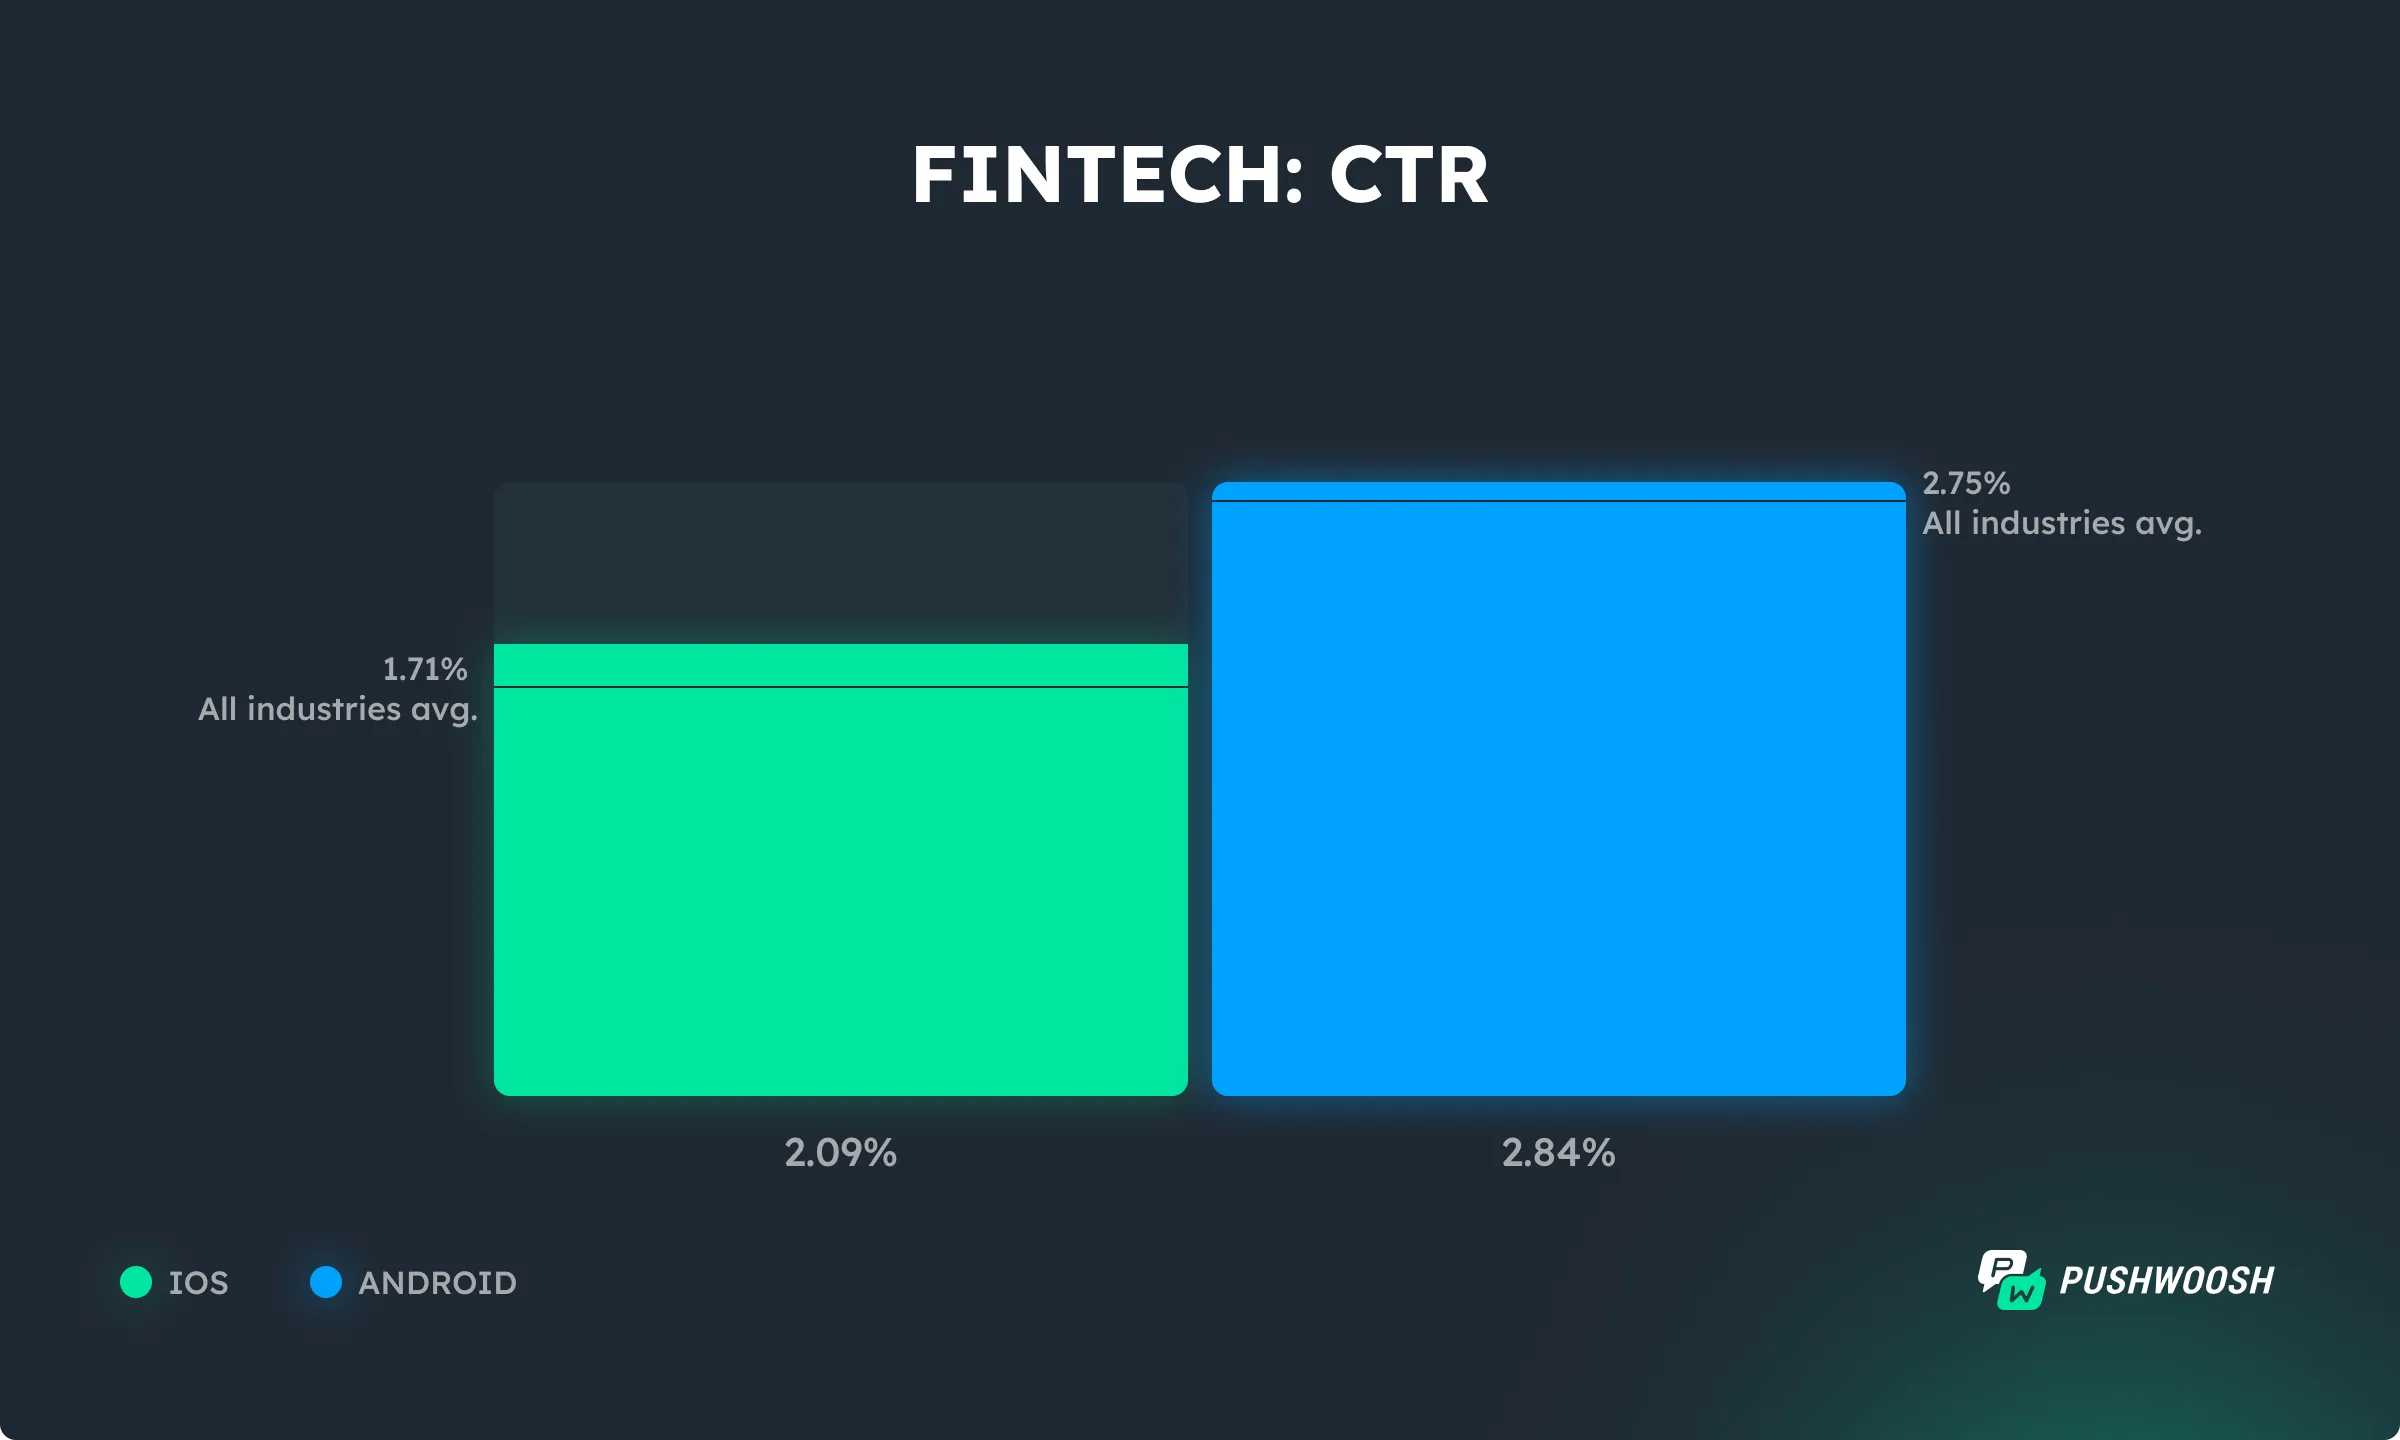
Fintech apps see higher push notification engagement on Android, with a CTR of 2.84%, while iOS follows at 2.09%. Despite the gap between platforms, both surpass the all-industries averages.
App performance metrics
DAU
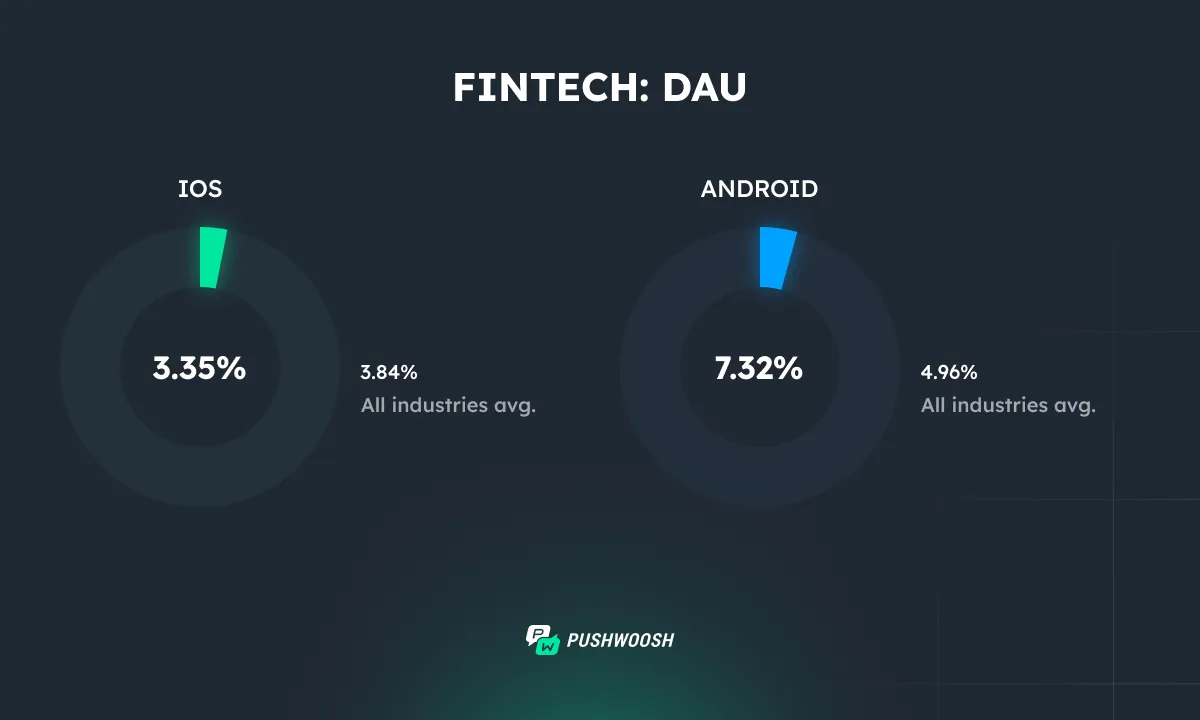
Daily active user rates on iOS fall just slightly below the all-industries average, while Android apps perform above the benchmark.
MAU
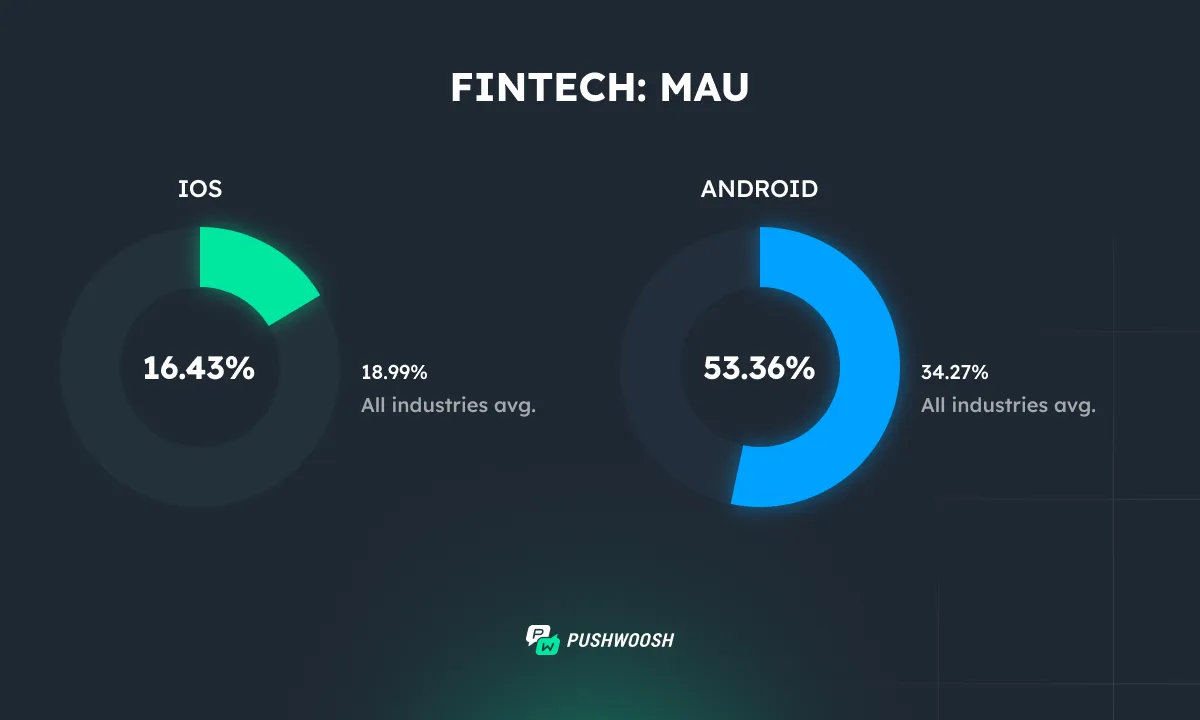
Monthly active user rates follow a similar pattern, with Android FinTech apps showing a much stronger engagement profile than the all-industries trend.
These usage patterns suggest that Android users interact with FinTech apps more frequently and consistently.
Action games
Push notification metrics
Opt-in
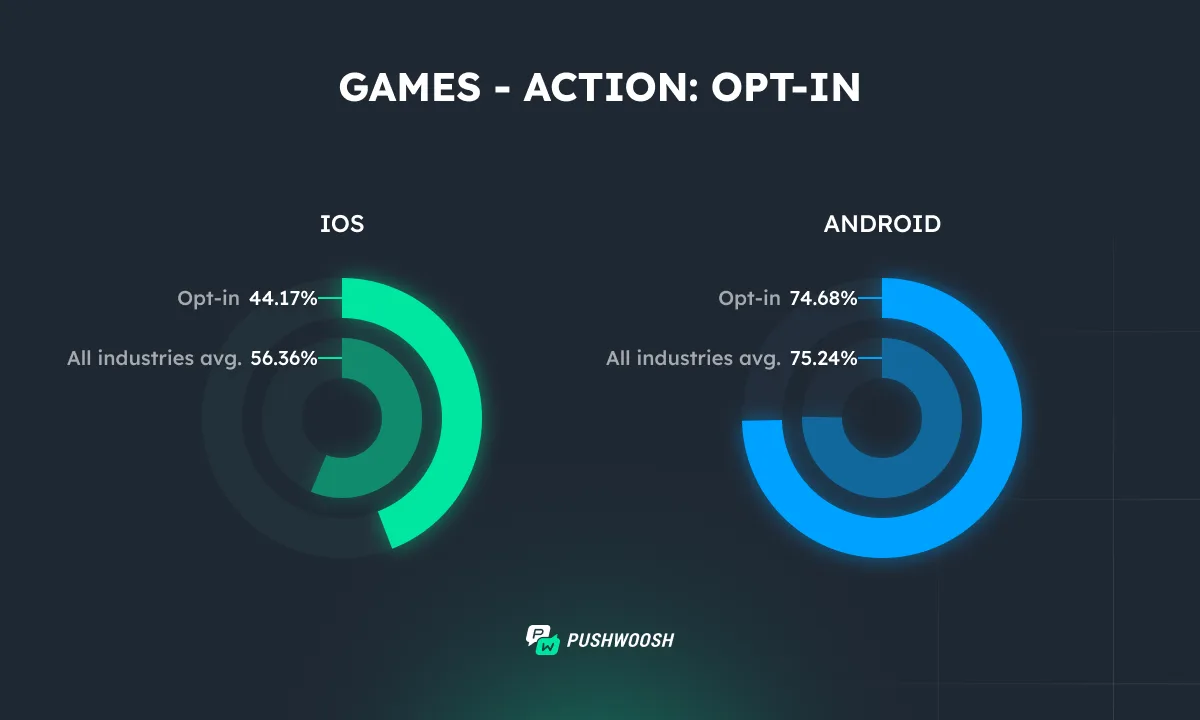
iOS users are significantly less likely to allow push notifications compared to the all-industries average. This suggests prompt fatigue or a perceived lack of value.
Android users, in contrast, show strong openness to real-time updates—though their opt-in rate is slightly below the all-industry benchmark, it remains high enough to support impactful messaging campaigns.
CTR
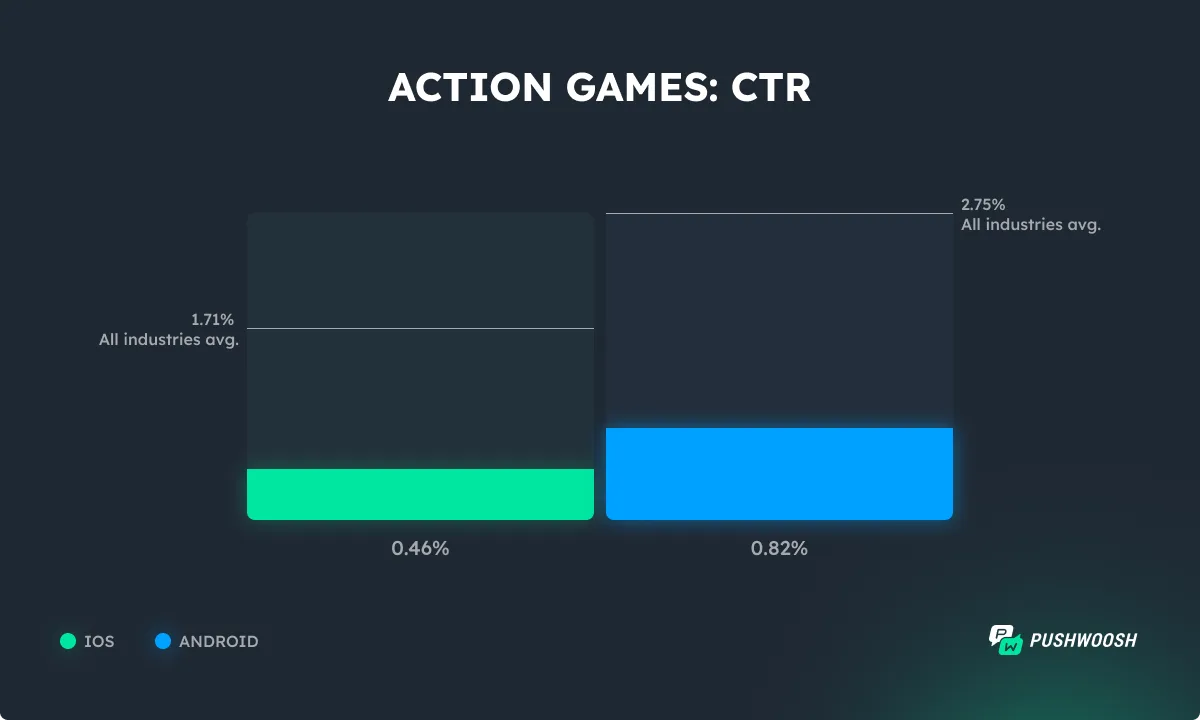
Action games are underperforming on both platforms compared to the all-industries average CTR. Android users show slightly higher engagement than iOS users, with a CTR of 0.82% on Android versus 0.46% on iOS.
💡Action point: Connect push notifications with in-game moments—such as new missions, PvP events, or energy refills—to align better with users’ expectations for timely, valuable updates.
App performance metrics
DAU
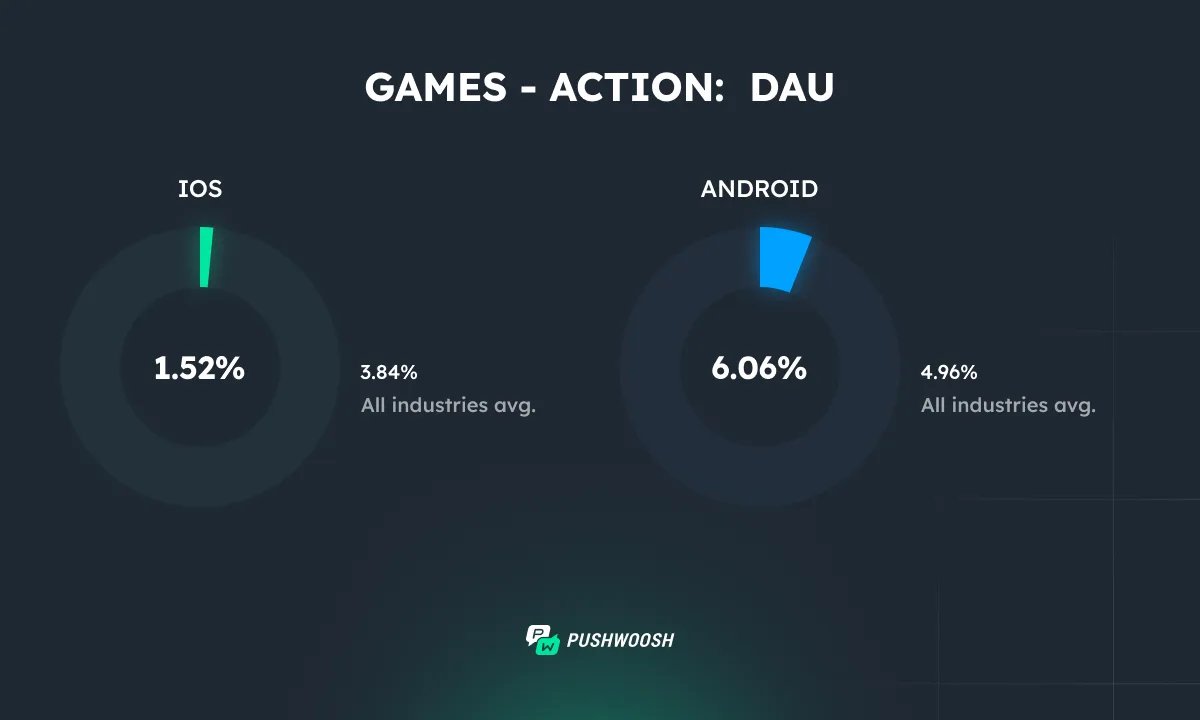
Daily usage is limited, especially on iOS, where activity falls well below the all-industry average. This may point to a lack of daily incentives or hooks that encourage habitual play.
Android users display stronger daily engagement, performing above the average
MAU
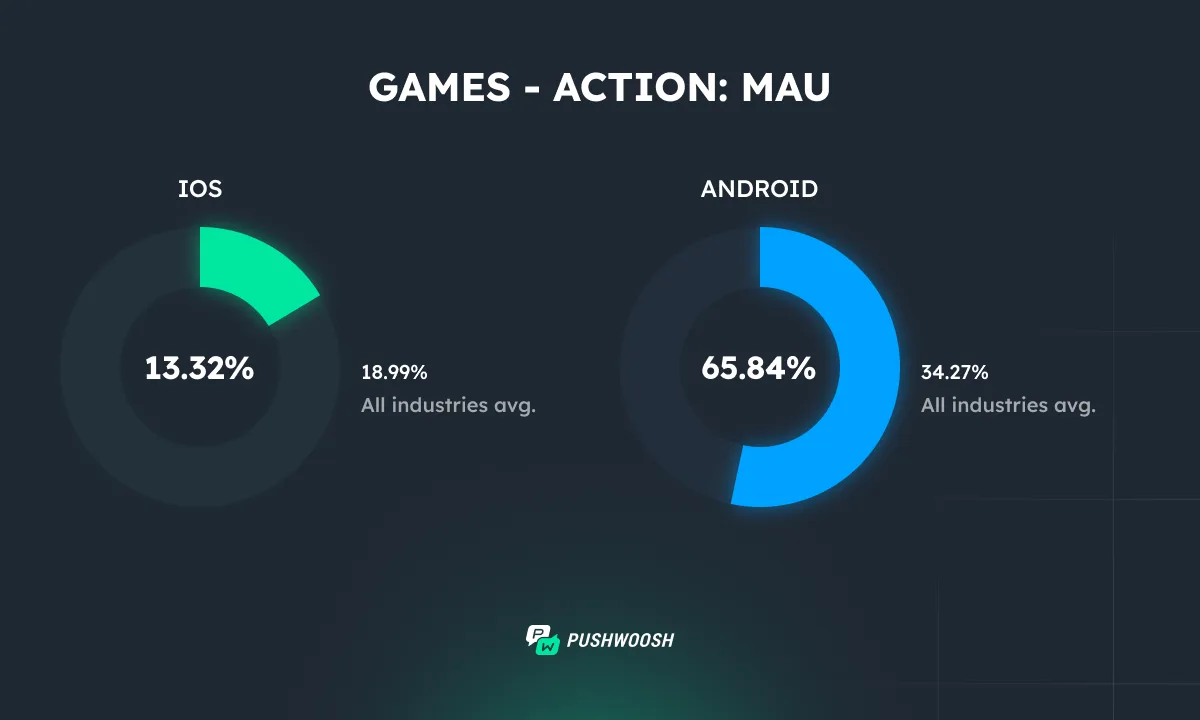
While iOS still lags, Android users remain highly active over time—showing one of the largest iOS–Android engagement gaps across all industries.
Once Android users are engaged, they tend to stick with the game for the long term. That retention potential makes Android a strong channel for scaling engagement strategies in the Action games segment.
Hypercasual games
Push notification metrics
Opt-in
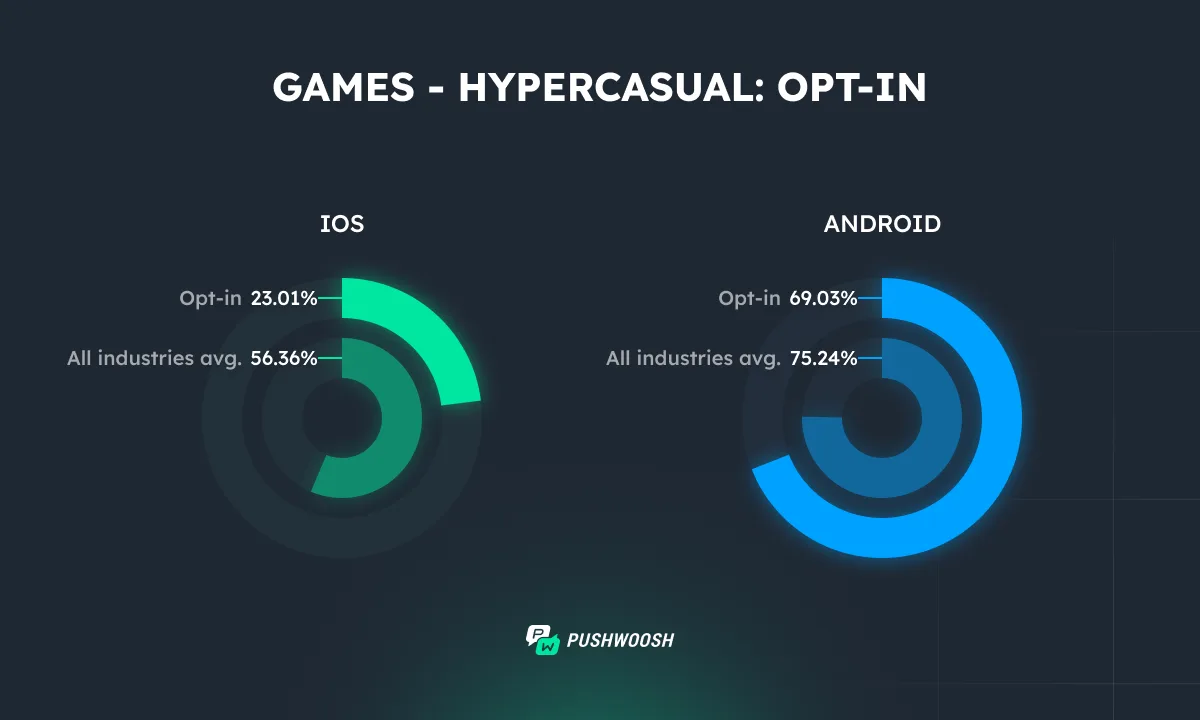
iOS users are significantly less likely to allow push notifications compared to the all-industries average. On Android, users are far more receptive—though opt-in rates fall slightly below the all-industry benchmark, they remain strong enough to support meaningful push notification strategies.
CTR
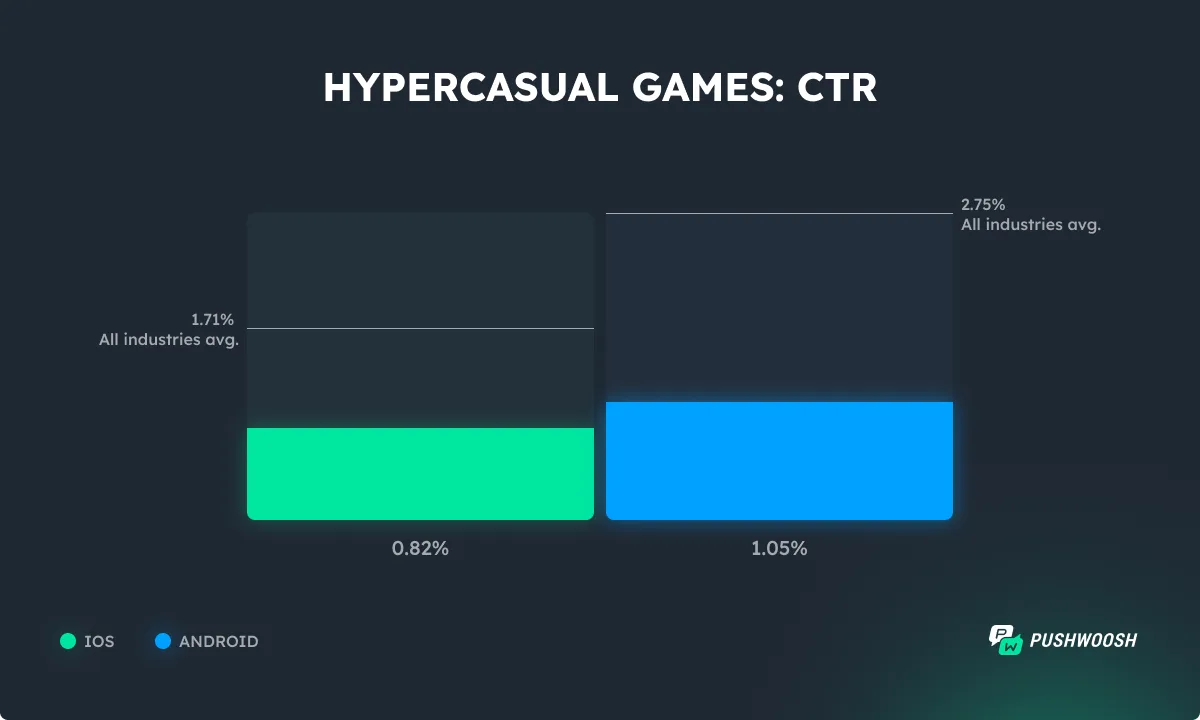
Hypercasual games on iOS have a CTR of 0.82%, which is lower than Android’s CTR of 1.05%. Both platforms fall below the all-industries averages.
App performance metrics
DAU
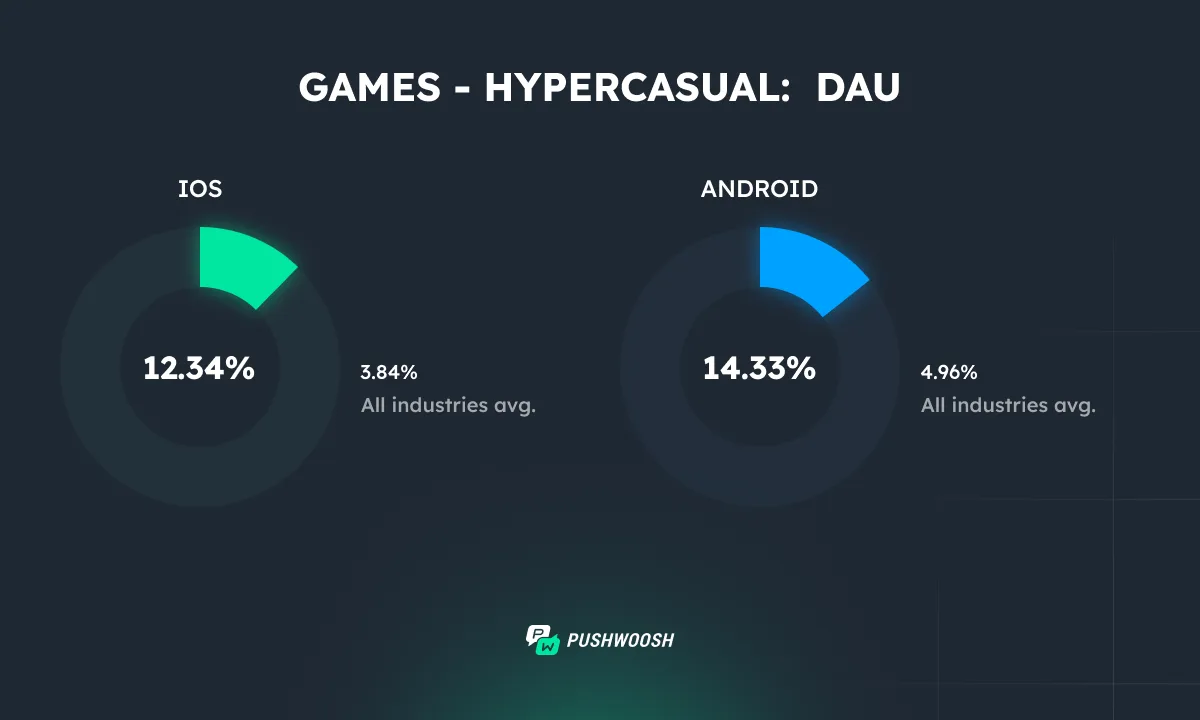
Daily engagement far exceeds the all-industries average on both iOS and Android. Hypercasual games effectively encourage frequent usage, likely driven by quick gameplay loops and accessible mechanics.
MAU
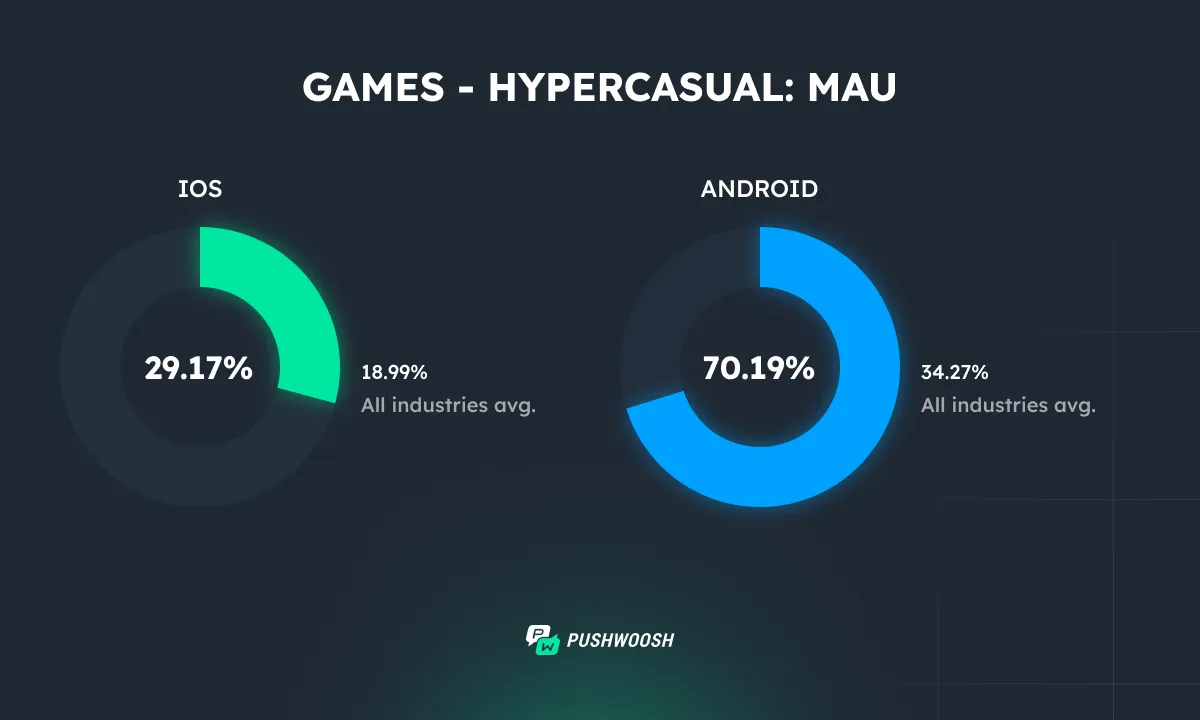
The MAU metric follows the same pattern, with hypercasual games significantly outperforming the cross-industry benchmark—particularly on Android.
💡Action point: Leverage strong natural retention on Android to scale monetization and campaign strategies.
Media & Entertainment
Push notification metrics
Opt-in
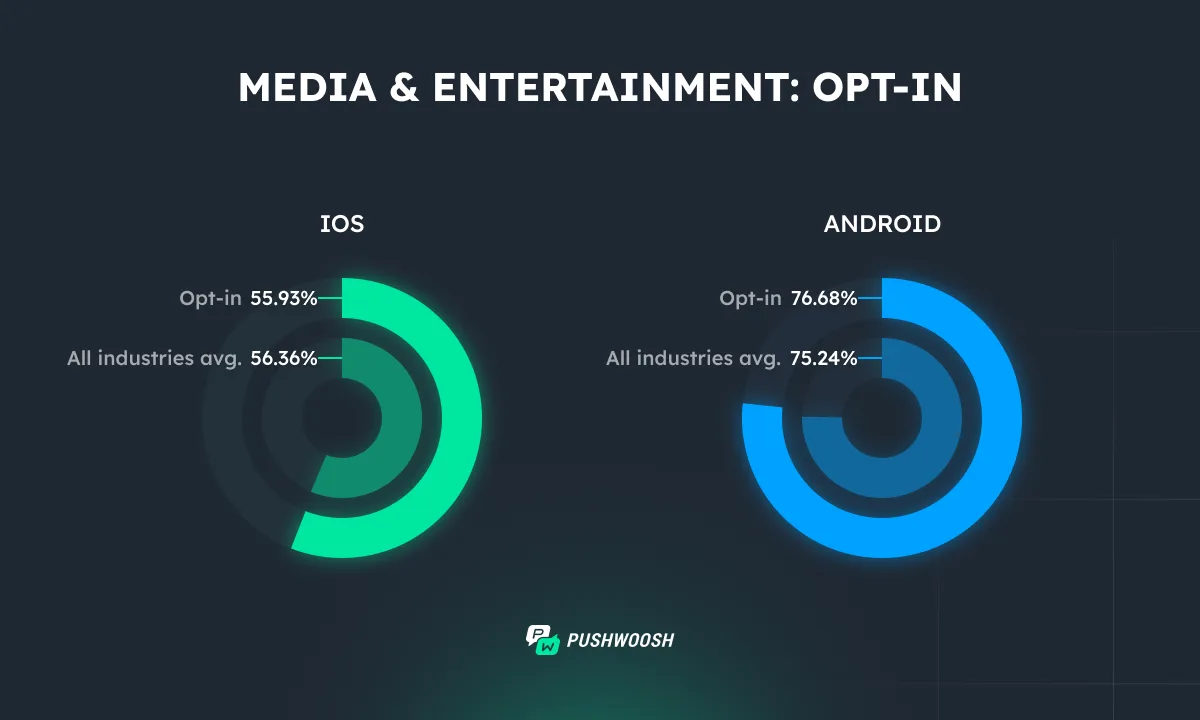
Opt-in rates are generally in line with industry benchmarks. iOS sees lower opt-in than Android, but both platforms show that users are reasonably willing to receive push notifications.
This reflects the typical user expectation to stay updated on content releases or streaming events.
CTR
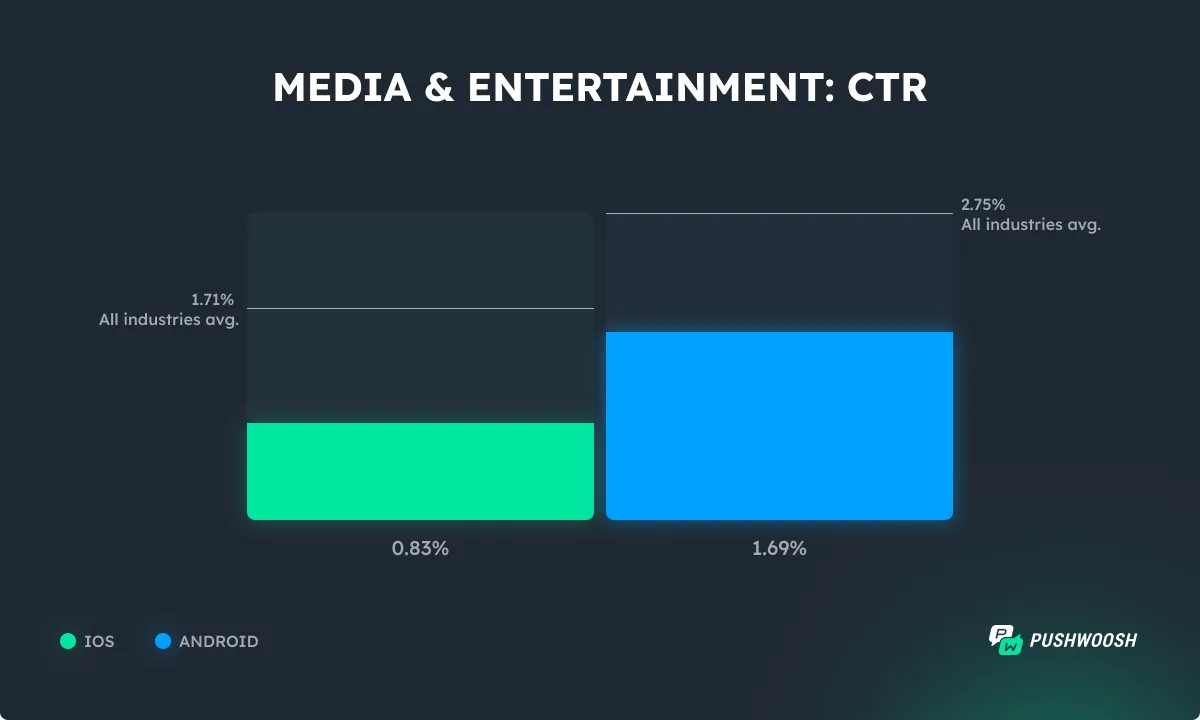
Media & Entertainment apps on iOS have a CTR of 0.83%, which is about half the engagement seen on Android, which has a CTR of 1.69%. Both platforms’ engagement rates are lower than the all-industries averages.
App performance metrics
DAU
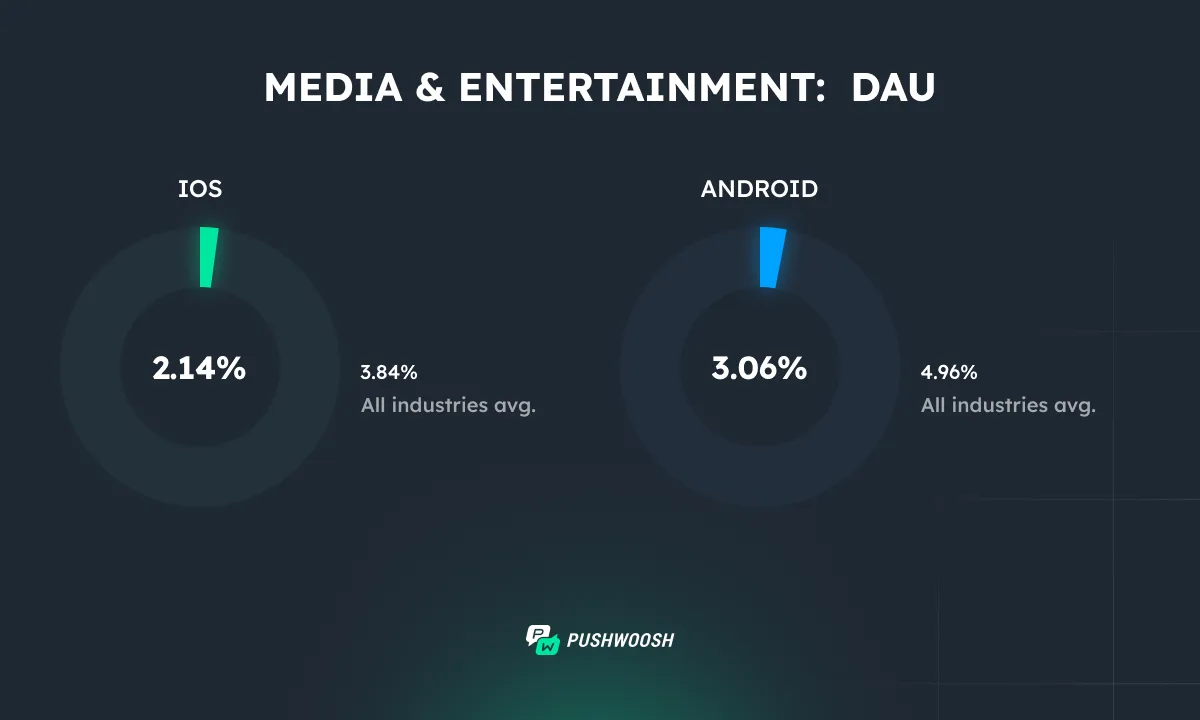
DAU falls short of the all-industries average on both platforms. This suggests users may interact with Media & entertainment apps more sporadically, perhaps depending on content drops or live events, rather than as part of a daily habit.
MAU
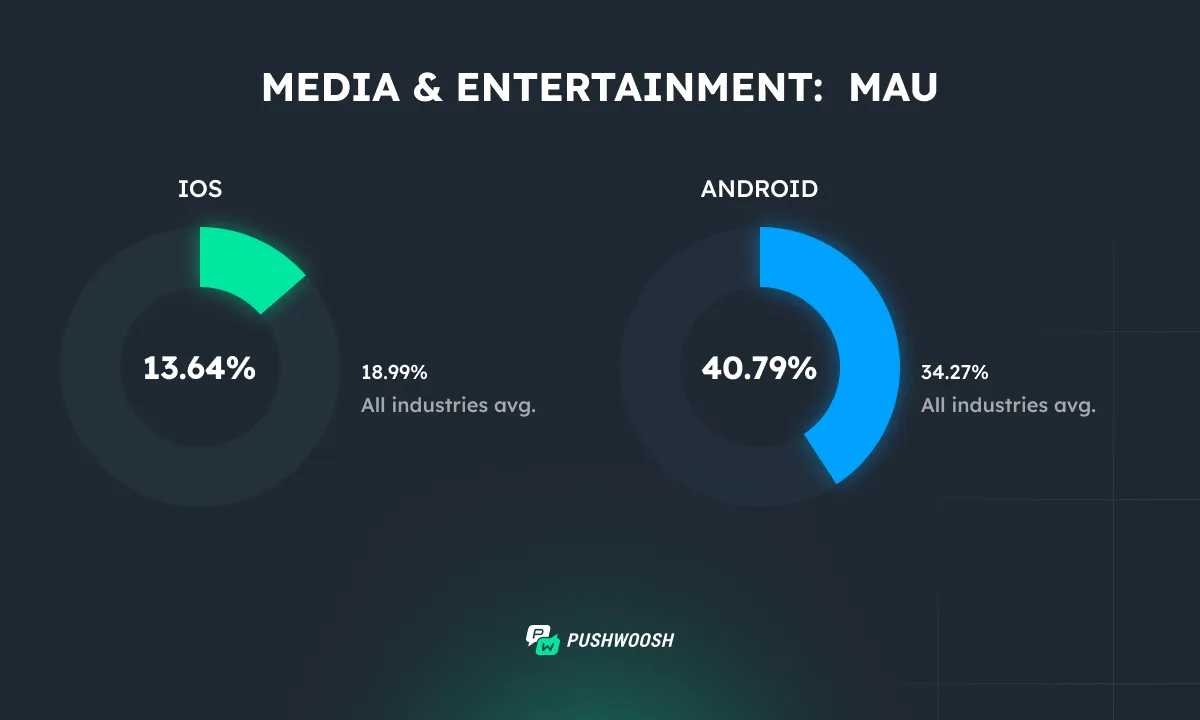
Monthly engagement shows a clear gap between platforms. Android users demonstrate high monthly activity—well above the all-industries average—indicating strong ongoing interest in Media & Entertainment apps.
On iOS, however, monthly activity lags behind the industry benchmark. This gap suggests that while Android users are consistently engaged over time, iOS users may require more targeted efforts to stay active month to month.
💡Action point: With strong DAU and MAU already in place, consider introducing customizable notification digests and follow-up alerts to deepen routine usage and reduce churn risk. Leverage location-based segmentation, as engagement levels can vary drastically between local and global media audiences.
Pushwoosh segmentation research shows that targeting users by town can yield up to 15x higher CTR, making hyperlocal content one of the most effective segmentation criteria for News apps. Delivering timely, town-specific alerts can turn general interest readers into highly engaged daily users.
News
Push notification metrics
Opt-in
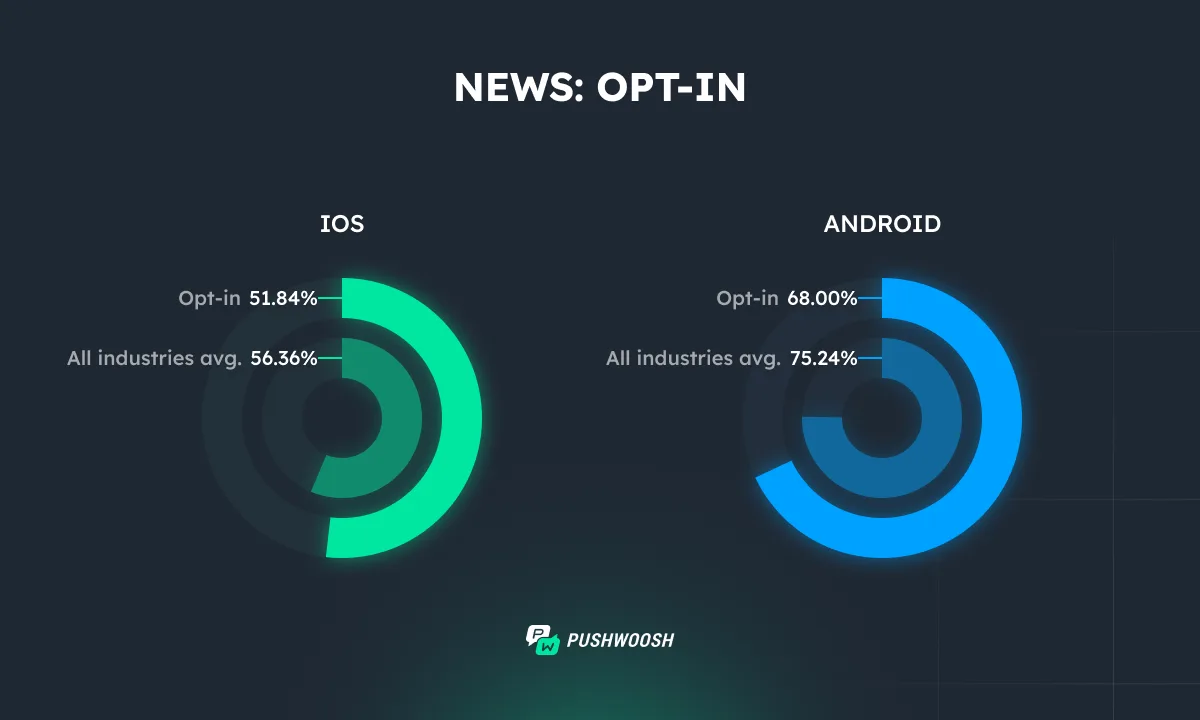
In the News category, opt-in behavior on both platforms falls below the all-industries average. Still, nearly half of iOS users agree to receive push notifications, and the rate is even higher on Android.
This shows that while users may be somewhat selective, there is still a solid foundation of interest in staying updated—especially given the time-sensitive nature of news content.
CTR
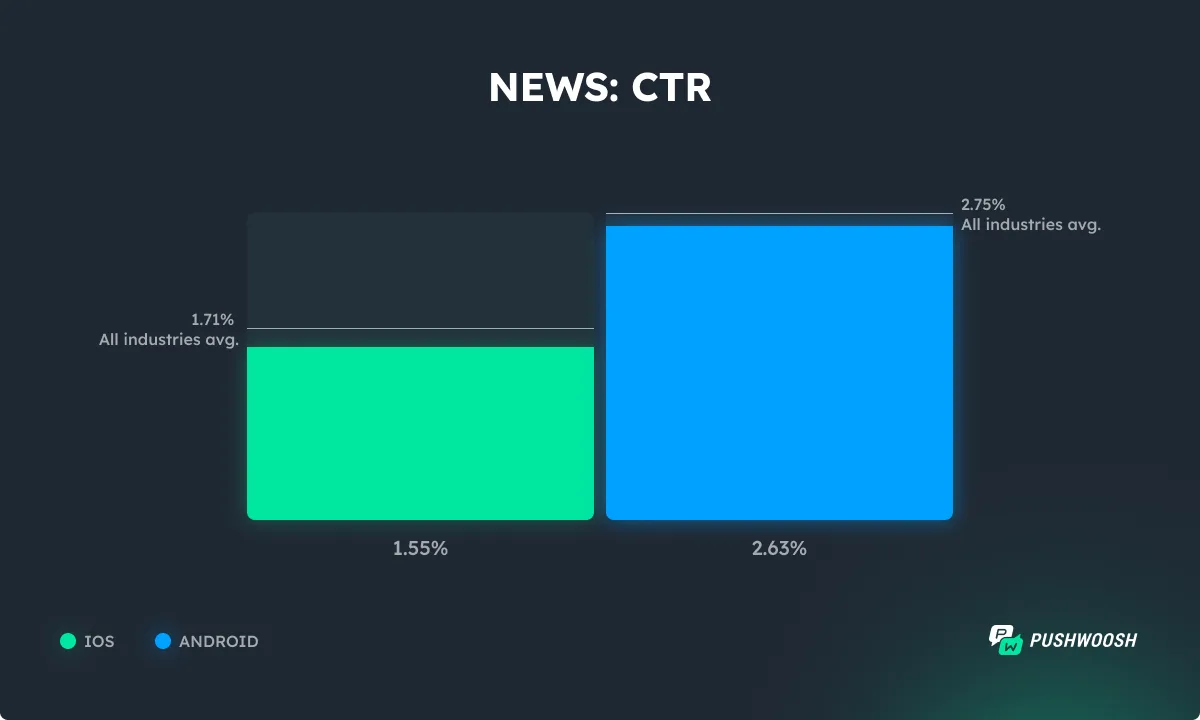
Although Android’s performance is very close to the all-industries average, both platforms’ engagement rates are still just below their respective all-industries benchmarks.
💡Action point: For iOS, leverage Live Activities to highlight live news coverage, breaking updates, or ongoing events directly on the lock screen. This format is helping you capture attention in real time and maintain high visibility without relying solely on traditional push notifications.
App performance metrics
DAU
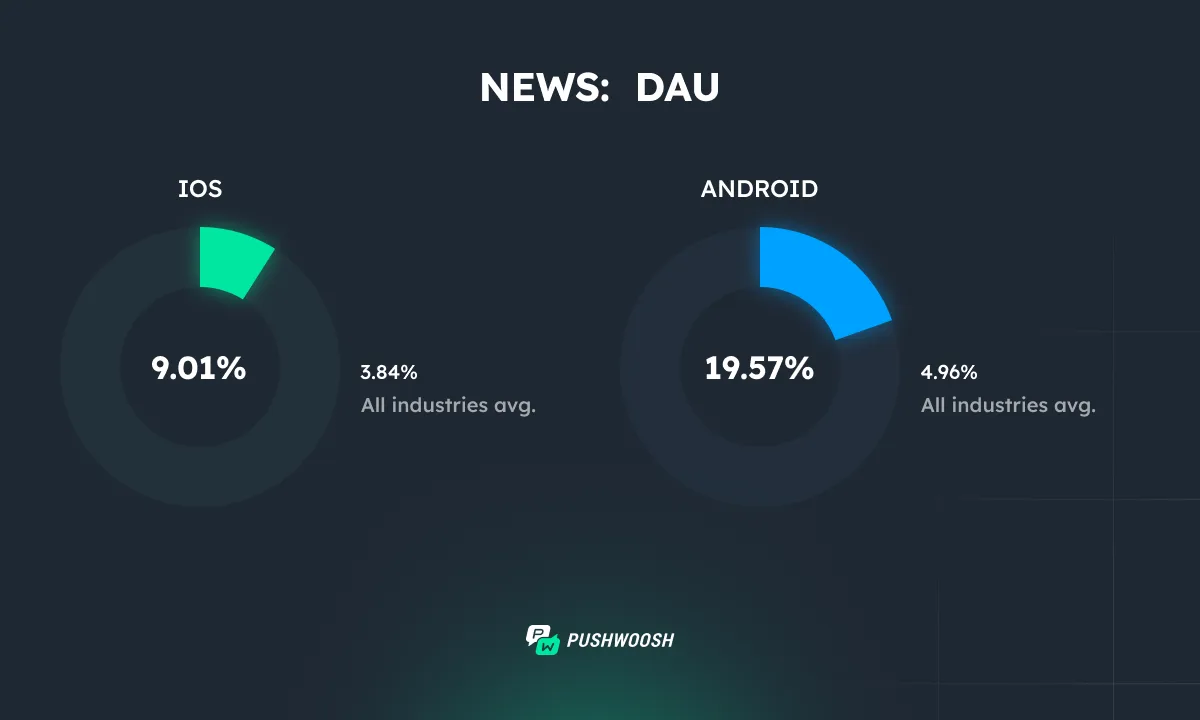
On both platforms, and especially on Android, DAU is significantly above the all-industries average. This reflects a strong habitual usage pattern, with users returning frequently to stay informed.
MAU
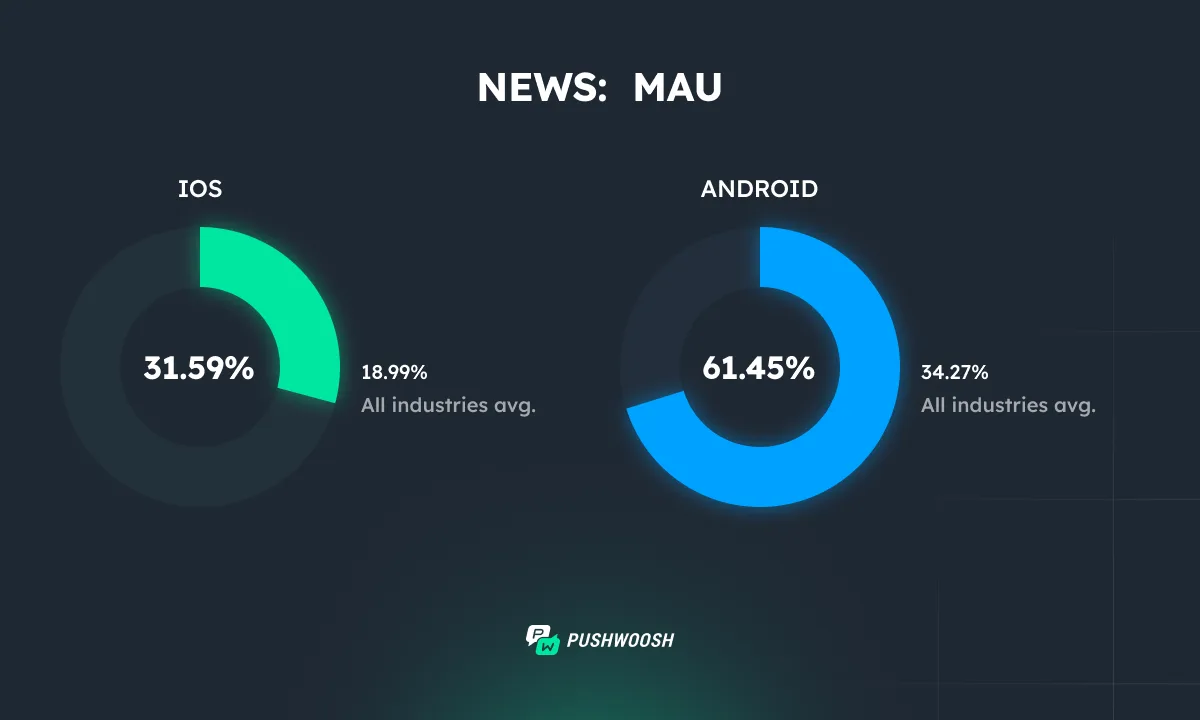
Monthly engagement is equally strong, again with Android leading the way. The platform sees exceptionally high monthly activity, while iOS—though slightly behind—still maintains levels well above the industry norm.
Looking to put these benchmarks into action? Whether you’re aiming to boost opt-ins, refine your push messaging CTRs, or improve app engagement, Pushwoosh gives you the tools to act on insights.