Elevate your messaging with analytics
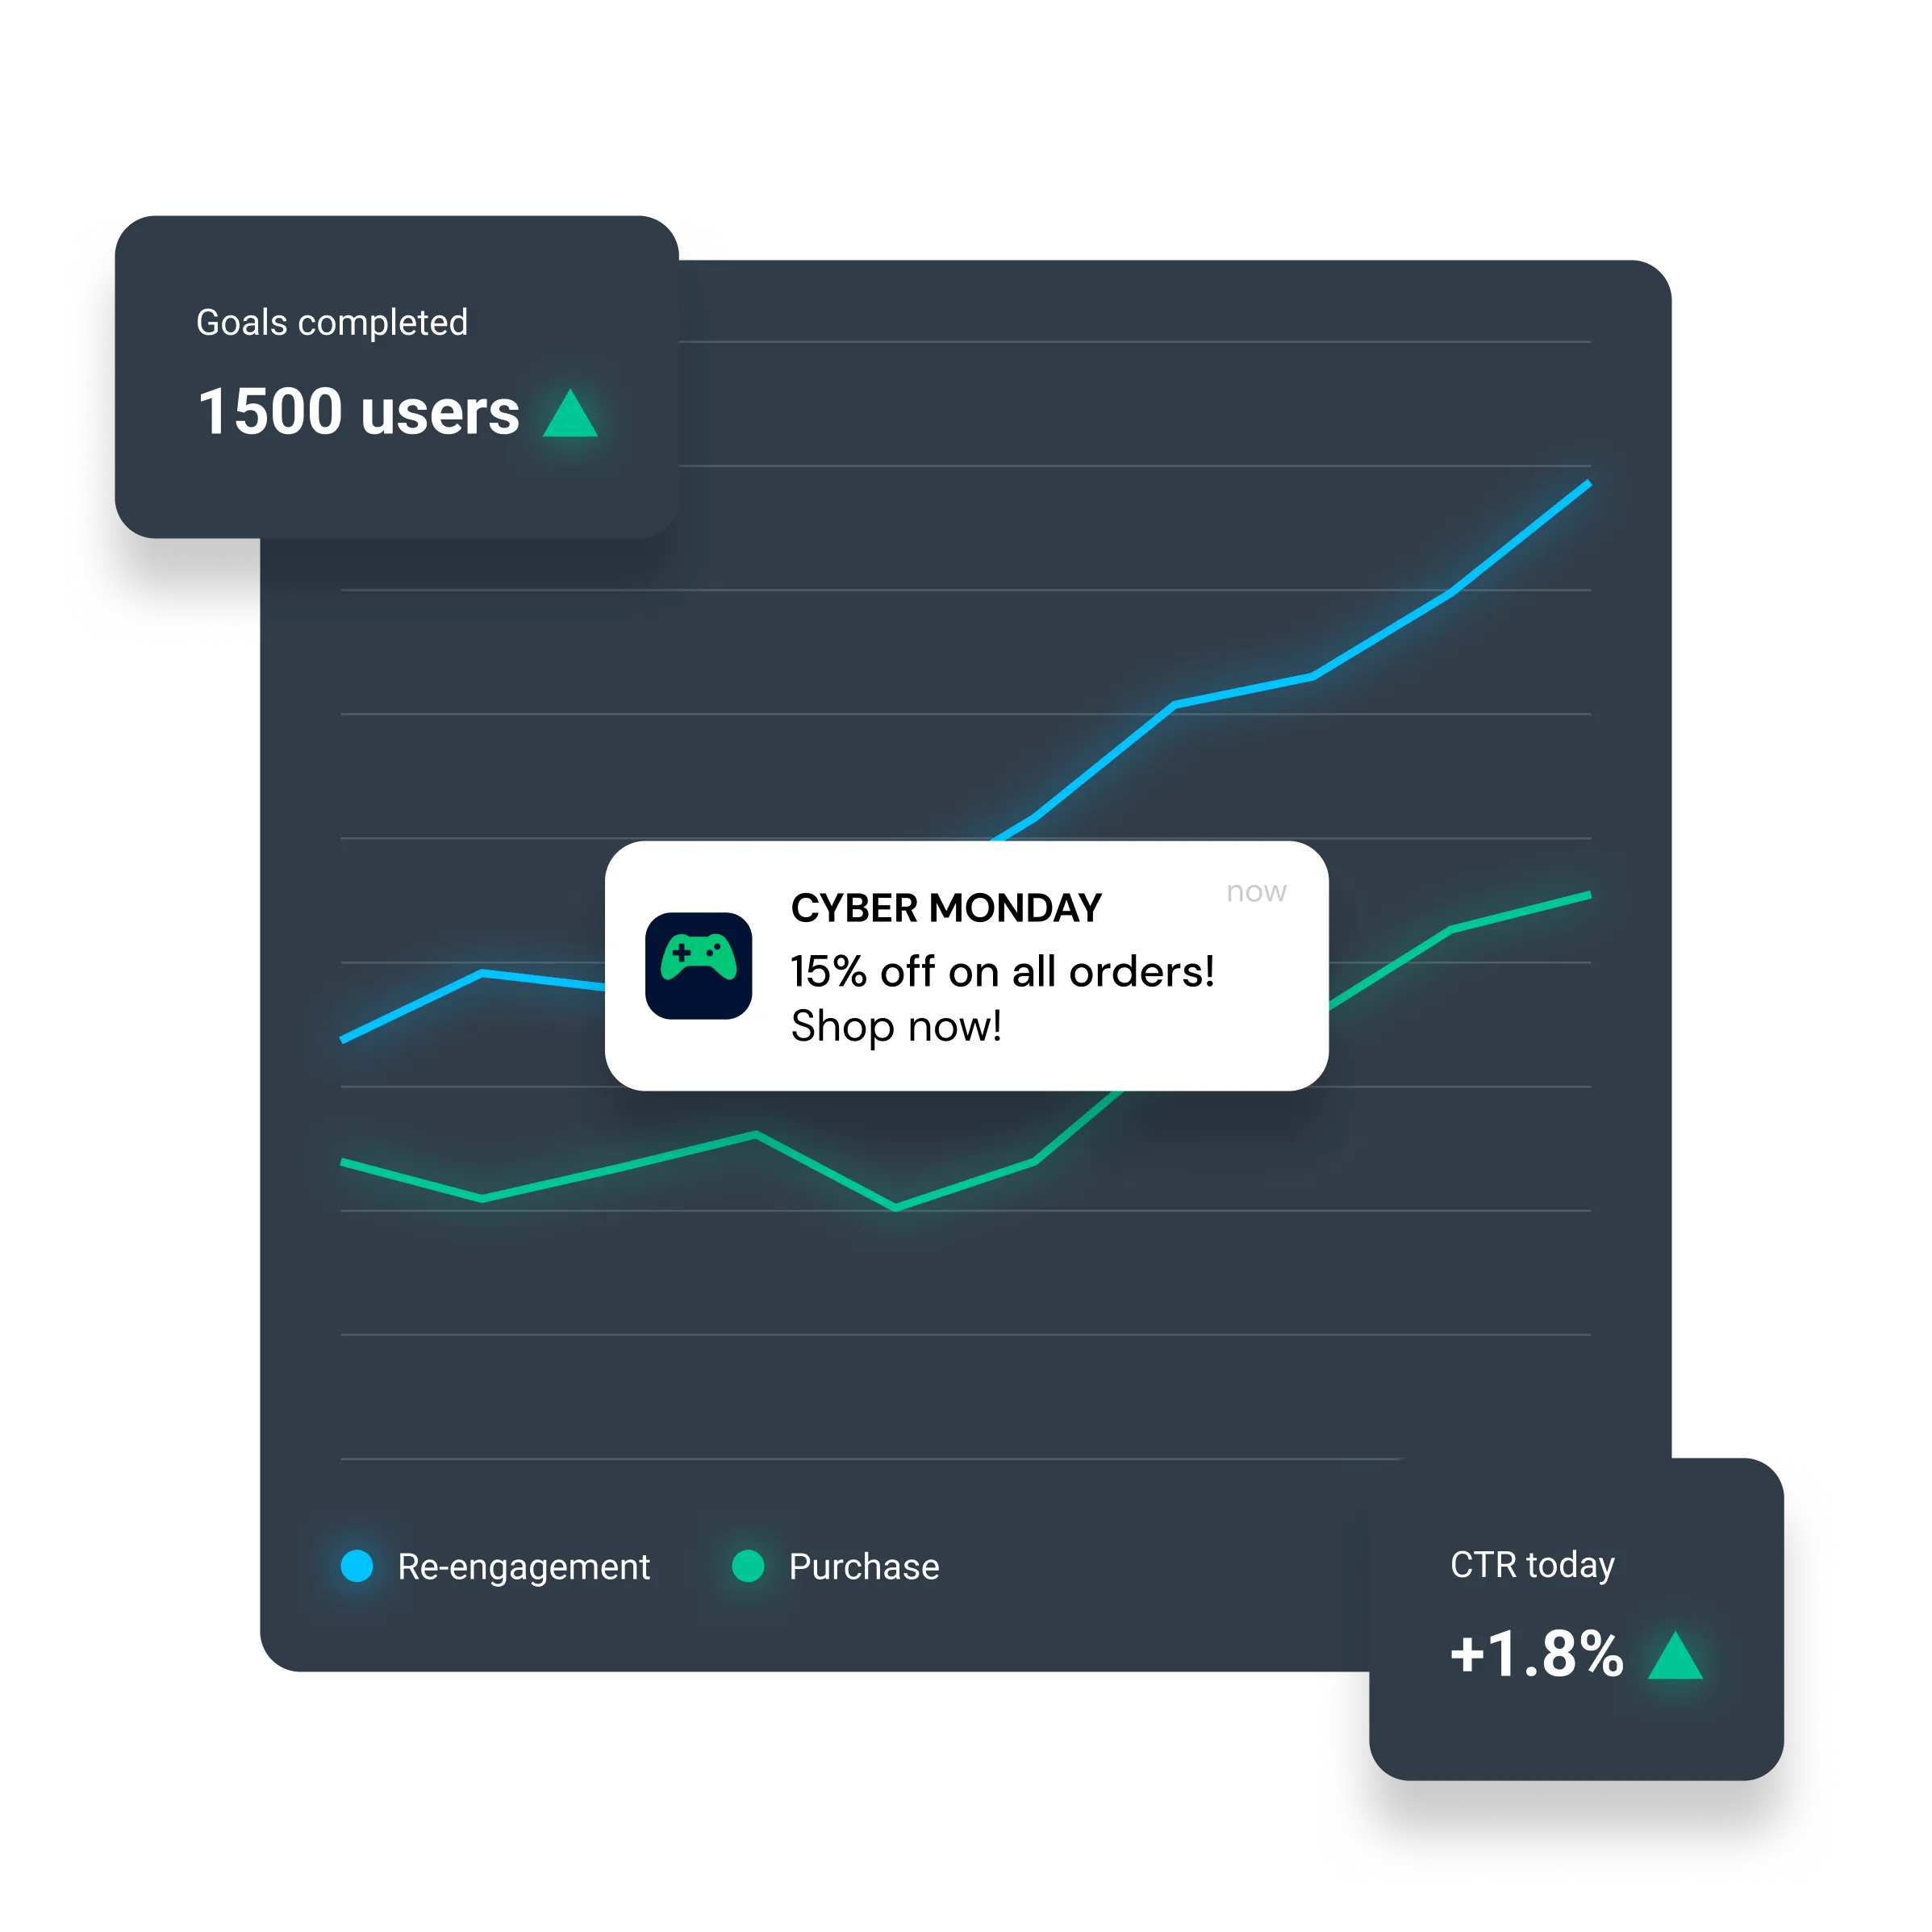
Gain actionable insights across all messaging channels and increase your campaign ROI with Pushwoosh's comprehensive analytics.

Campaign performance
Track campaign results and fine-tune your communication logic to lead more users to the target action.
- Conversions and drop-offs;
- Real-time statistics on every step of the customer journey;
- Channel-level campaign statistics;
- Yesterday / today campaign CTR;
- Detailed user paths.
Messaging analytics
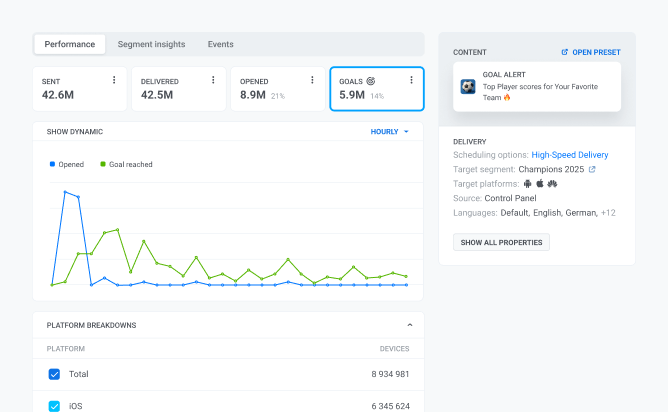
Track individual message performance to maximize engagement and conversions.
- Push notifications: Sends, deliveries, opens, CTR, event hits, and errors;
- In-app messaging: Impressions, interactions, drop-offs;
- Email: Sends, deliveries, opens, CTR, unsubscribes;
- Message history: Past push notifications and emails (up to one year).

Dashboards
Visualize and demonstrate your performance with flexible, filterable dashboards, ideal for KPI reporting.
- Fully customizable: Tailor dashboards to your needs, selecting metrics and layout.
- Channel dashboards: Track key metrics across push, in-app, and email channels.

Audience and event analytics
Discover trends and growth opportunities by analyzing your app metrics, audience behavior, and conversion funnels in depth.
- App performance: MAU & DAU, push subscribers, recipients by platform;
- Segment statistics: Engagement across different audiences;
- Conversion funnel: Identify bottlenecks and growth points in user journeys.

Integrations and data mobility
Work freely with your data without being tied to a single tool. Enjoy seamless analytics flow across platforms.
- Data import and export capabilities;
- Event streaming to external systems;
- Integrations with third-party analytics platforms.
Technology partners
Seamless integration with third-party services

Retention analytics
Stay ahead of churn by tracking retention patterns and tailoring campaigns to different user profiles.
- Retention curve analysis: See the percentage of users who stay active over time.
- Key metrics: Track D1, D7, and D30 retention.
- RFM grid: Identify high-value and pre-churn users.
With Pushwoosh, our analytics team gains more meaningful data and can provide actionable insights based on it.
Real-time updates
All campaign data in one place, updated in real time.
Granular insights
From individual messages to aggregated results.
Flexible integrations
Data mobility and freedom of integration.
Visual clarity
Intuitive dashboards that make insights easy to grasp.