Drive conversions with smart A/B testing
Stop guessing, start testing. A/B test every element of your campaigns: subject lines, copy, images, send times, offers. Measure impact with statistical confidence. Auto-select winners and scale what works.
What A/B testing delivers
Built-in A/B testing for all campaigns. Test push notifications, emails, in-app messages, and SMS. Set up tests in minutes, get results in hours, and let automatic statistical significance pick the winner. Continuous optimization that compounds over time.
Increase conversion rates
Every test finds improvements. Winning variants convert 10 to 50% better than losers. Continuous A/B testing drives 20 to 40% conversion improvement over 6 months.
Make data-driven decisions
Replace opinions with evidence. Know what works based on real user behavior. 95% confidence level ensures decisions are based on real performance differences, not random variation.
Reduce campaign risk
Test before full launch. Catch underperforming copy, confusing CTAs, or bad timing before sending to entire audience. Test with 10% of audience, scale winner to remaining 90%.
Continuously improve performance
Every campaign is an opportunity to learn. Iterative testing compounds gains. Month 1: 5% lift. Month 6: 35% cumulative improvement from continuous experimentation.
Test everything that impacts conversion
Six element categories cover every lever that moves campaign performance. Pick the one with the biggest potential impact for your audience, build variants, and let the platform measure what wins.
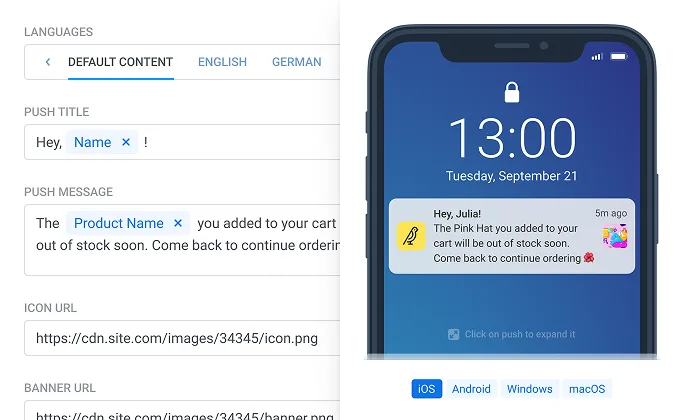
Message copy and content
Test headlines, body copy, CTAs, emoji usage, and personalization level. Words drive action, and small wording changes move the needle in push notification campaigns.
- Subject line: “50% off today” vs “Your exclusive 50% discount” vs “Don’t miss 50% off”
- Push copy: “New sale live” vs “Flash sale: 50% off” vs “Sarah, your favorite items are on sale”
- CTA button: “Shop now” vs “See deals” vs “Claim discount”
- Typical impact: 15 to 40% conversion difference between variants
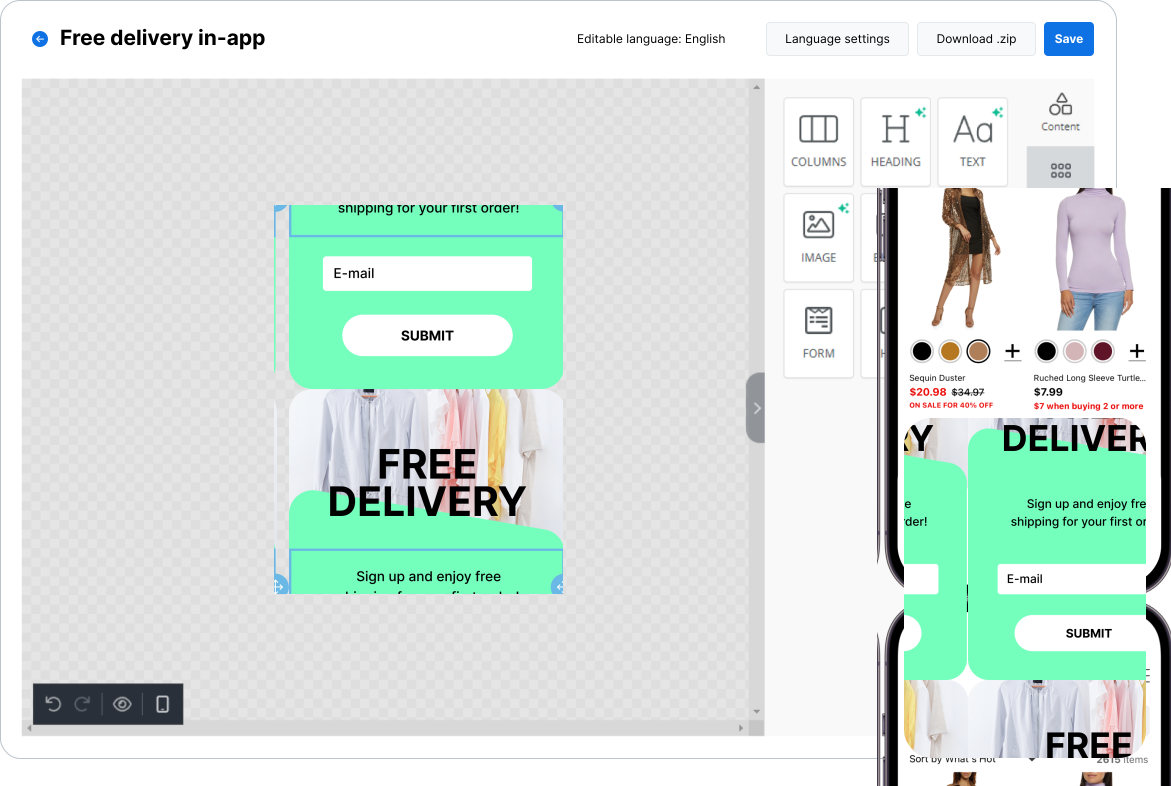
Visual elements
Images, colors, layout, video vs static, and brand elements drive attention. The right format dramatically changes engagement in in-app messages and rich media campaigns.
- Push image: product on white vs lifestyle context vs no image
- In-app format: full-screen vs modal vs banner
- Email layout: hero image vs text-only vs animated GIF
- Typical impact: 10 to 30% conversion difference based on visual choice
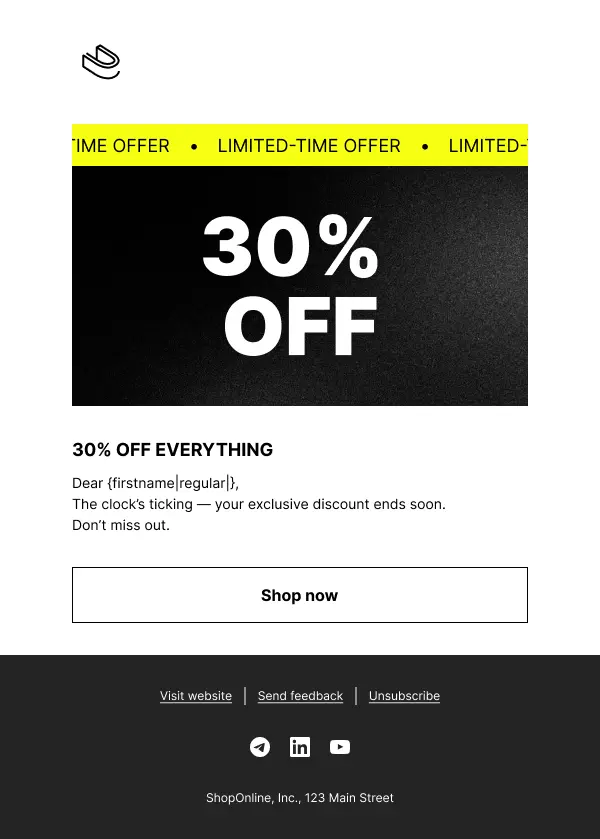
Offers and incentives
Discount level, offer type, urgency framing, and exclusivity have the largest impact of any test category. Offers are where you find compounding wins.
- Discount: “20% off” vs “$20 off $100” vs “Free shipping on orders $75+”
- Urgency: “Sale ends tonight” vs “24 hours left” vs “Hurry, almost sold out”
- Exclusivity: “Everyone gets 25% off” vs “VIP members: 30% off”
- Typical impact: 20 to 50% conversion difference (the highest-leverage test category)
Timing and frequency
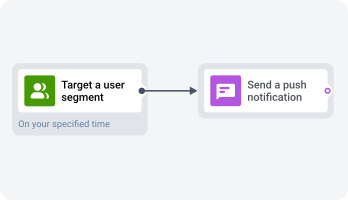
Send time, day of week, frequency, and delay timing decide whether your message gets seen at all. The right time beats the cleverest copy.
- Send time: 9 AM vs 12 PM vs 6 PM vs 9 PM
- Day of week: Monday vs Wednesday vs Friday vs Saturday
- Delay: immediate vs 2 hours vs next day
- Typical impact: 10 to 25% engagement difference based on timing
Audience segmentation
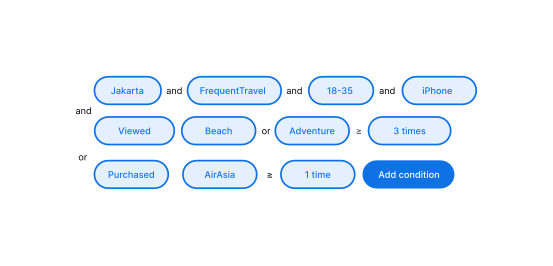
Segment breadth, personalization depth, user-type targeting, and behavioral triggers turn a generic blast into a relevant message. Segmentation tests reveal which slices respond to which approach.
- Targeting: all users vs viewed product vs added to cart
- Personalization: generic vs name vs name plus behavior
- Lifecycle: new vs 30-day active vs VIP tier
- Typical impact: 30 to 60% conversion difference with proper segmentation
Channel and format
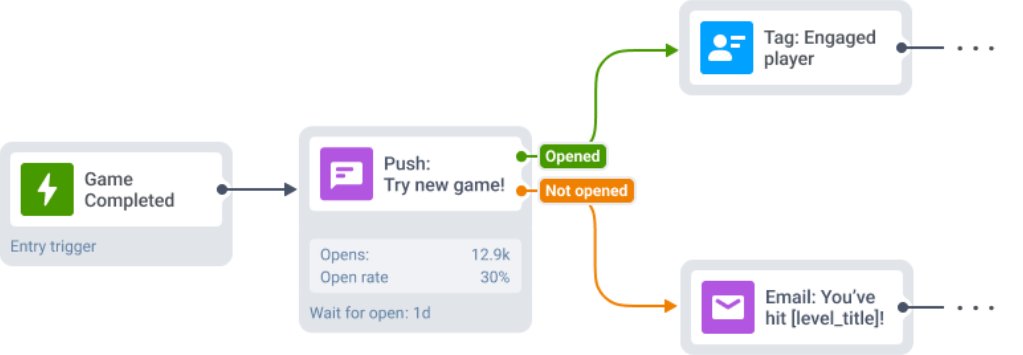
Push vs email vs SMS vs in-app, rich vs simple, interactive vs static, and single message vs sequence. Channel fit decides whether your campaign even has a chance.
- Channel: push vs SMS for time-sensitive offer
- Format: plain text email vs HTML with images
- Sequence: single reminder vs 3-message cart abandonment sequence
- Typical impact: 20 to 40% difference based on channel fit
From hypothesis to insights in minutes
Five-step process from variant creation to scaled winner. Each step has the controls a serious testing program needs, with sensible defaults for teams starting out.
-
Create test variants
Set up a control (variant A) and one or more challengers (B, C, D). Change one element per test for clear cause-and-effect learnings. Example: A: "Sale ends tonight" / B: "12 hours left: 50% off" / C: "Last chance: your favorites at 50% off".
-
Define test parameters
Configure traffic split (50/50, 33/33/33, or custom), test duration, sample size, and success metric (open rate, click rate, conversion, revenue). Example: 25% A, 25% B, 50% holdout for winner rollout, 24-hour duration, CTR as success metric.
-
Statistical significance calculation
Platform calculates confidence automatically and warns about early stopping with insufficient data. Below 90%: not significant, need more data. 90 to 95%: likely significant. Above 95%: highly significant, clear winner.
-
Winner selection and scaling
Pick manually after reviewing results, or let the platform auto-select once confidence threshold is reached. Advanced: multi-armed bandit dynamically reallocates traffic to better performers during the test, maximizing conversions even before a winner emerges.
-
Document learnings
Record the winning variant, the lift, and the takeaway. Build a testing playbook. Example findings: "Urgency language drives 28% higher conversion." "Personal name in subject: +15% opens." "Evening sends 7-9 PM perform 32% better than morning."
Test across all marketing channels
Different channels demand different test priorities. Run experiments where the leverage is biggest for each format, and orchestrate the winners across the entire customer journey.
Push notification testing
Test copy, emoji, images, deep links, and timing. Mobile notifications are short and every word matters. Emojis can lift engagement 20 to 30%. Typical results: 15 to 40% engagement improvement from testing.
Email testing
Subject lines drive 70% of opens, so they deserve the most testing time. Add tests on layout, image vs text, and CTA count. Typical results: 20 to 50% improvement in opens and clicks.
In-app message testing
Test format (modal vs banner vs full-screen), copy, trigger timing, and image presence. Less intrusive formats test better for retention; context-aware triggers crush time-based ones. Typical results: 25 to 60% lift based on format and timing.
SMS testing
Test message length, link placement, offer clarity, sender name, and emoji usage. Keep under 160 characters, include clear CTA, and respect opt-out rules. Typical results: 10 to 30% CTR difference between variants.
Run better tests, get better results
Eight habits that separate teams running mature testing programs from teams running occasional one-off experiments.
Test one variable at a time
Isolate what's being tested for clear cause and effect. Test subject line OR send time, not both at once. Clean isolation produces actionable learnings.
Use sufficient sample size
Minimum 1,000+ users per variant. Example: 10,000 users reach significance in 6 hours. 500 users may take days. Larger samples mean faster, more reliable results.
Run for appropriate duration
At least 24 hours to capture time-of-day patterns. Ideally 3 to 7 days for weekly patterns. Don't stop too early (false positives) or run too long (diminishing returns).
Respect statistical significance
Wait for 95% confidence before declaring a winner. Small differences below 5% may not be meaningful. Don't cherry-pick early results.
Test continuously
Every campaign is a testing opportunity. Example: Month 1 subject lines, Month 2 timing, Month 3 offers. Each test builds on the last for compounding gains.
Document and share learnings
Keep a testing log, share wins with the team, build institutional knowledge. "Evening sends work better" applies to every future campaign.
Test big ideas, not just tweaks
Bigger swings, bigger wins. Don't just test button color. Test discount level (20% vs 40%) or offer type (% off vs free shipping).
Prioritize high-impact tests
Subject lines beat send time. Offers beat copy tweaks. Segmentation beats emoji choice. Example: testing offers (20% vs 30%) has 10x the impact of testing emojis.
Track what matters
Pair every test with the right metric. The platform tracks the full funnel automatically through Pushwoosh analytics, so you can compare variants on the dimension that actually matters to your business.
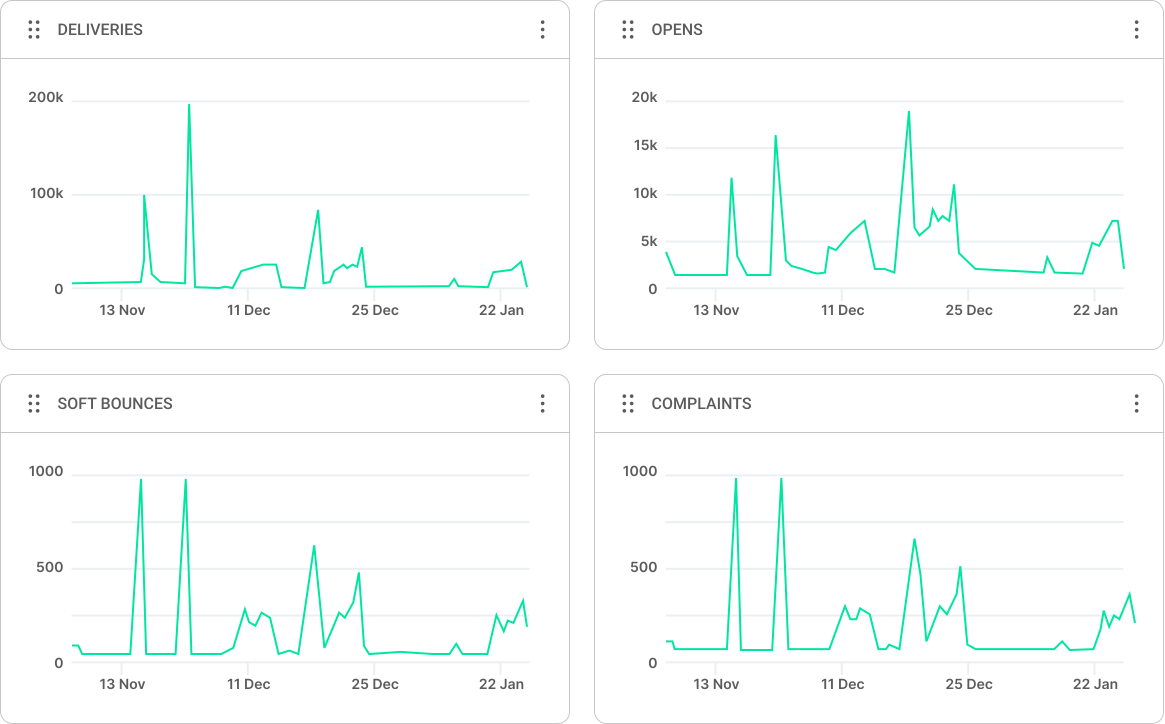
A/B test dashboards built for marketers
Real-time visibility into every active test: variant performance, statistical confidence, sample size, time to significance, and revenue per send. Segment performance breakdowns reveal which audiences respond to which variant. Channel-comparison views show whether the same test should run differently on push vs email vs SMS.
Open and click rates
Baseline engagement metrics by channel. Push: 40 to 60% delivery. Email: 20 to 35% opens. SMS: 95%+. CTR targets 10 to 25% for healthy campaigns.
Conversion rate
% who completed the desired action. Purchase, signup, download, or app open. The ultimate success metric tied to business outcome.
Revenue per send
Average revenue generated per message. Accounts for conversion AND order value. The right metric for e-commerce because higher CTR doesn't always mean higher revenue.
Statistical confidence
Likelihood that the variant difference is real, not random. Target 95%+ before scaling a winner. Displayed prominently throughout the test lifecycle.
Lift
% improvement of winner over control. "Variant B converted 22% higher than A." Tracked per test and cumulatively across the program.
Time to significance
How long until 95% confidence is reached. Helps plan test duration. Varies by traffic volume and effect size. Example: 10K users, 6 hours; 1K users, up to 24 hours.
Start testing smarter
See how marketers use A/B testing to continuously improve campaign performance. Test everything, measure impact, scale what works. Better results through experimentation.
Explore related products
Map out and streamline your campaigns with one visual tool. Communicate, engage, retain, convert, segment, and experiment using Pushwoosh Customer Journey Builder.
Drive activation with customer onboarding journeys. Send contextual tips, progress updates, and feature highlights that turn signups into active users.
Drive engagement with event-based triggers. Automatically launch campaigns when customers take actions, capturing perfect moments for conversion and retention.
First purchase onboarding platform that builds loyalty. Guide new customers, educate about products, and create experiences that drive repeat business.
Unify customer experiences with multi-channel orchestration. Coordinate messaging across email, SMS, push, and more for seamless, personalized journeys.
Your all-in-one email marketing platform: Pushwoosh. Customize templates, automate email flows, analyze performance, and aim even higher!