Analyzing push notification metrics is sort of easy. All eyes are on click-through rates, a gateway to conversions. With in-app messages, it’s a bit more complicated. Unlike push notifications, in-app messages don’t rely on a traditional open rate metric. This is because in-app messages are displayed directly within the app interface, eliminating the need for users to take a separate action to open them. How do you define in-app messaging effectiveness, then? What metrics should you look at? Find your answers in this blog post.
Key in-app messaging metrics to track
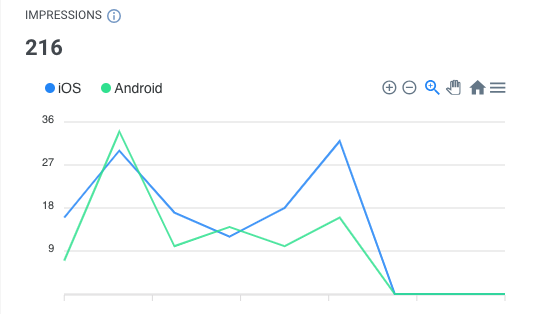
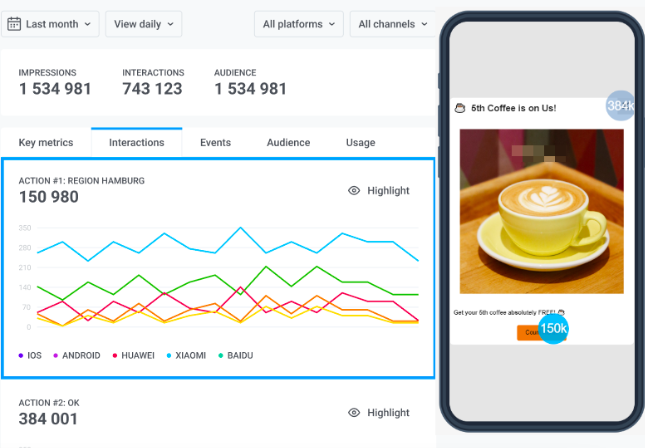
1. Impressions
Impressions show how many times the in-app message popped up for users in a set period. In Pushwoosh In-app Statistics, you can analyze impressions based on OS type to better understand the in-app performance for different audiences:
In Pushwoosh, you can also see the exact list of reached users (active devices on which the in-app was displayed). Watch this video to learn how to use Pushwoosh Statistics in your campaigns:
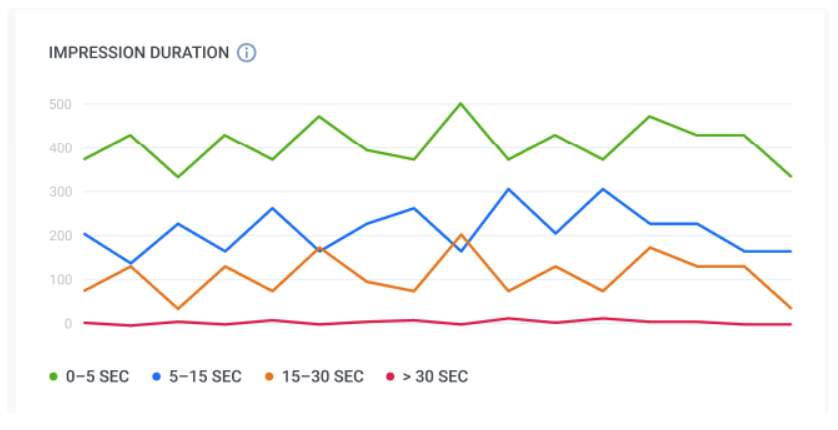
2. Impression duration
Impression duration is a crucial metric that tells you how long users actually looked at your in-app message. This provides insights into user attention span so you can refine your content’s look and message for better impact.
In Pushwoosh, the relevant graph segments users based on their impression sessions:
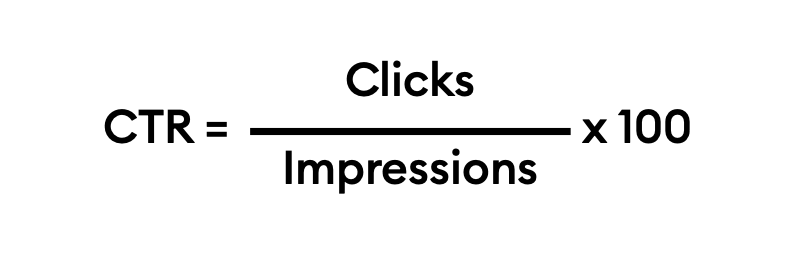
3. CTR
This metric indicates the percentage of users who interacted with an in-app by clicking on buttons and tapping links within the message:
4. Interactions
This metric reflects the number of button clicks/link taps.In Pushwoosh In-App Statistics, you can explore user interactions by utilizing a heatmap, spotlighting the elements most frequently engaged with, including close or action buttons:

5. Conversion rate
The conversion rate for in-app messaging measures the percentage of users who completed a target action after interacting with the in-app message.
In Pushwoosh, you can additionally analyze user behavior between receiving a message and triggering a target action via a Conversion Funnel feature. For that, you should define the Events that users trigger after receiving an in-app message and evaluate the percentage of users that proceed to the next step.
Here’s an illustration of a conversion funnel, beginning with an in-app view and culminating in an in-app purchase:
- MessageViewed: 100% of users see the discount offer.
- PageViewed: Among those who receive the in-app, 50% of users check out the discounted product.
- AddCart: Among those who viewed the product, 40% of users add the product to their cart.
- Purchase: 20% of users complete the purchase.
Understanding these percentages helps identify drop-offs and refine crucial steps such as the checkout process or product presentation to improve overall conversion rates.
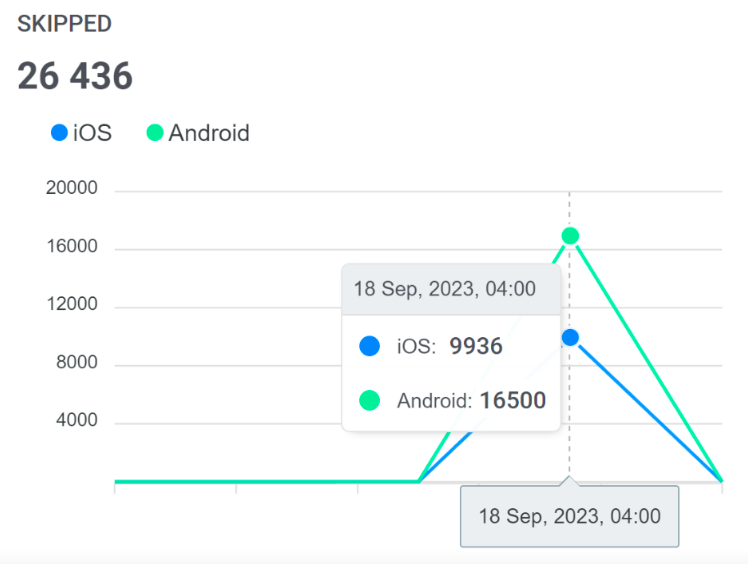
6. Skipped in-apps
This metric shows the number of users who closed the in-app without interacting with it:
These are the key performance metrics you should track to measure the effectiveness of your in-app messaging. If you have any questions about these rates, industry benchmarks, or strategies to enhance your metrics, don’t hesitate to contact Pushwoosh Team. We’ll be more than happy to help.