Predictive analytics for marketing automation
Know what your customers will do before they do it. Predict churn, forecast conversions, and identify high-value customers automatically. Machine learning that turns behavioral data into revenue-driving campaigns.
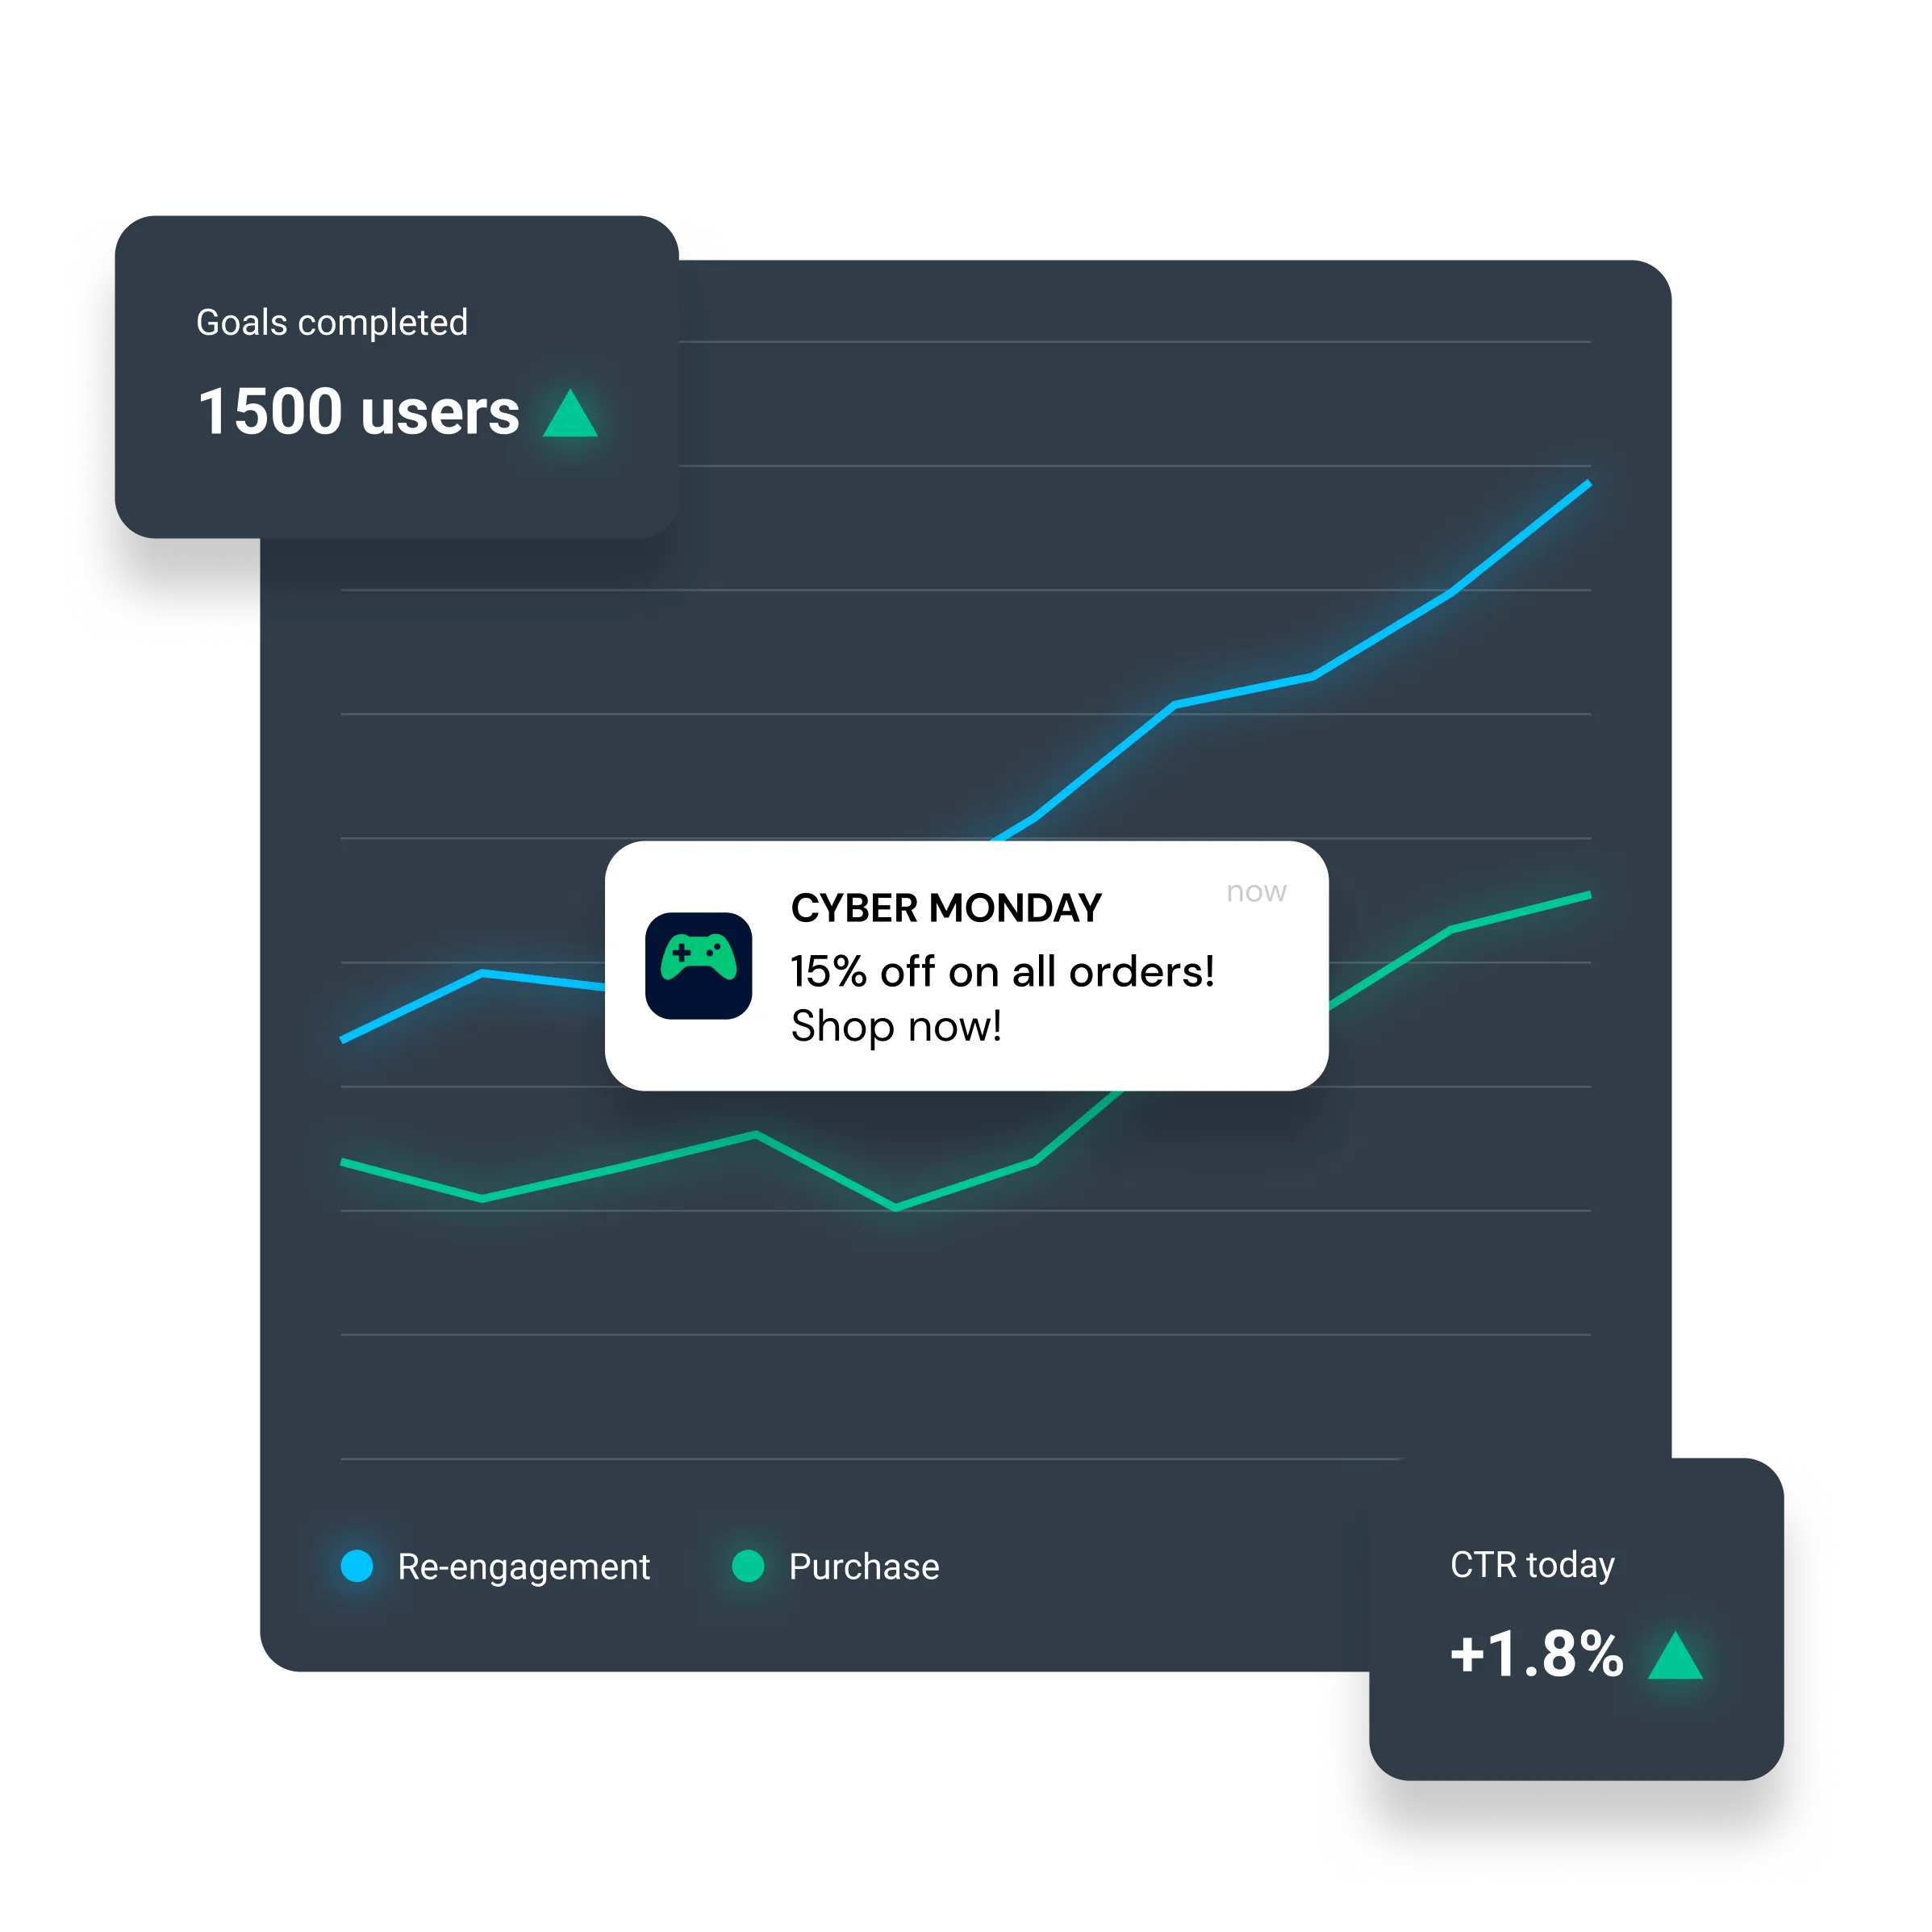
Predictive marketing, no data science team required
Automatically score every customer for churn risk, conversion likelihood, and lifetime value. Trigger campaigns before customers churn, upgrade before they disengage, and convert before they leave.
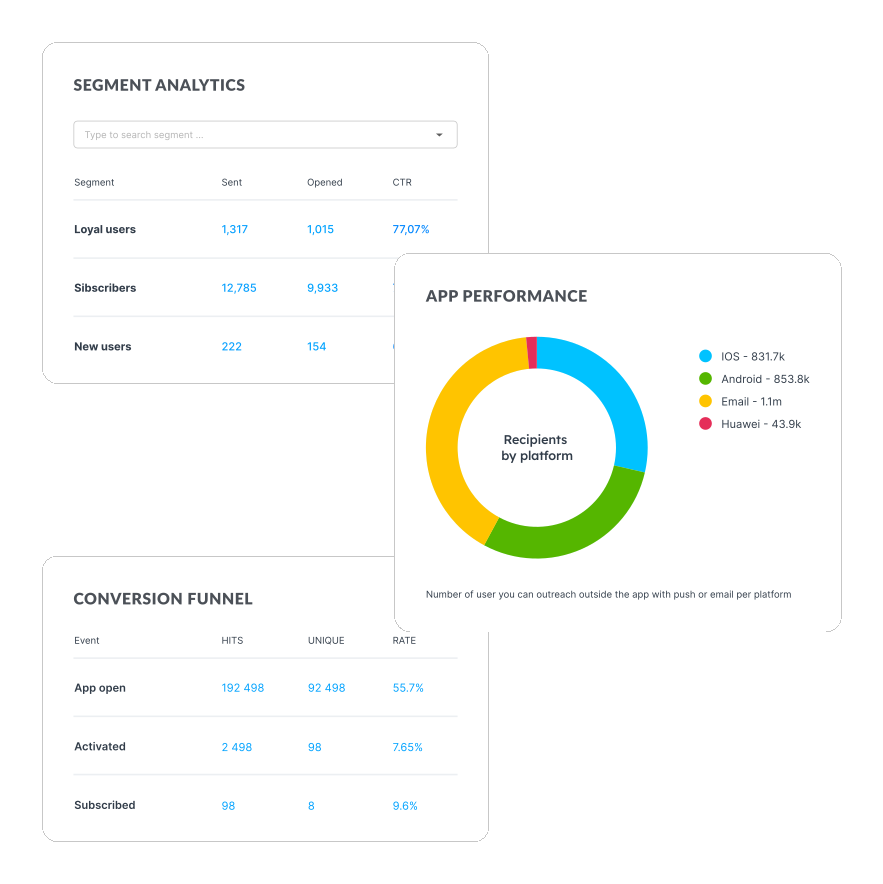
What predictive analytics delivers
Predict churn before it happens
Identify customers 30 to 60 days before they churn from early warning signals in behavior patterns. Trigger retention while you can still save them, not after they are gone. Churn models flag at-risk customers with 85% accuracy, and proactive campaigns retain 60% of them.
Score every customer for conversion
Machine learning scores every user for likelihood to purchase, upgrade, or complete a key action. Focus budget on high-probability users instead of those unlikely to convert. The high-score segment converts 4x better than average: same budget, 4x the revenue.
Predict lifetime value
Forecast which new customers will become high-value over time and spot rising stars early. Predicted high-LTV customers are identified within the first 7 days with 78% accuracy, and early VIP treatment increases LTV by 35%.
Automate next best action
AI determines the optimal next campaign for every customer based on predicted behavior: right message, right time, right offer. Next best action automation increases campaign ROI by 45% versus manual campaign planning.
Predictive models built for marketers
Six models score every customer continuously and feed directly into your campaigns. No feature engineering, no tuning, no statistics degree.
Churn prediction
Scores every customer 0 to 100 for likelihood to churn in the next 30, 60, and 90 days.
Behavioral signals
Declining session frequency, shorter sessions, reduced feature usage, fewer purchases, rising support contacts, login anomalies, and a falling engagement score.
Output
Churn risk score, risk tier, primary churn drivers, predicted churn date, and a recommended intervention.
In campaigns
Score above 70 triggers an immediate retention campaign. 40 to 70 enters re-engagement. Below 40 stays on standard nurture. Example: a player has not logged in for 4 days and spend dropped 80%, so churn risk hits 82 and an urgent win-back fires.
Accuracy
85% precision identifying churners 30 days before they leave.
Conversion prediction
Scores every user for likelihood to convert on a specific action: purchase, upgrade, subscribe, or register.
Behavioral signals
Product and feature view frequency, time on the pricing page, cart additions, email engagement, feature adoption depth, search behavior, and comparison activity.
Output
Conversion probability, predicted time window, trigger recommendation, optimal offer, and channel preference.
In campaigns
Above 70% gets a nudge because they are ready. 40 to 70% gets an incentive to tip them over. 20 to 40% gets education to handle objections. Below 20% stays in nurture. Example: a user viewed pricing 3 times this week, so probability hits 78% and an offer campaign fires.
Accuracy
72% accuracy predicting conversions within the predicted window.
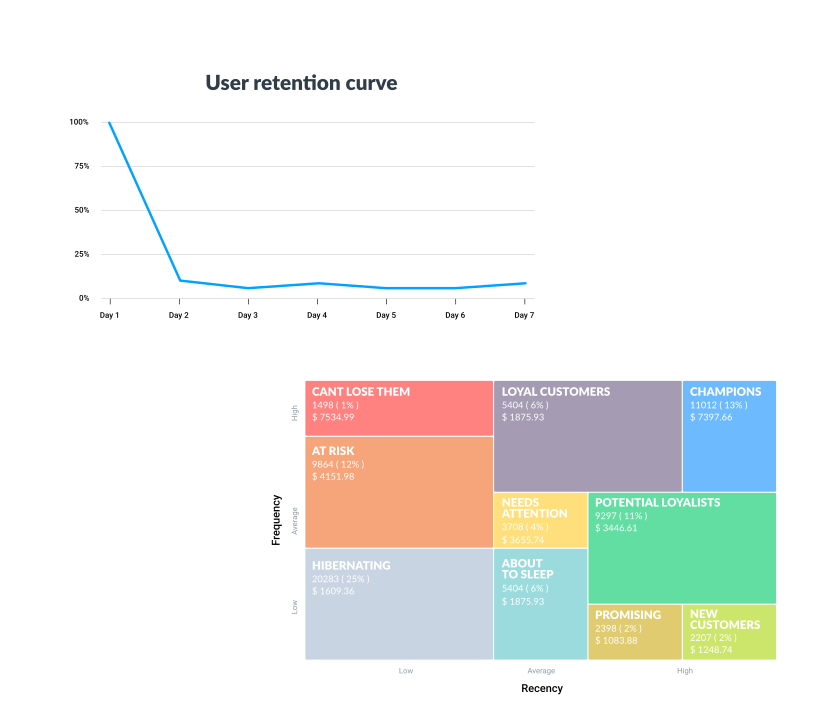
Customer lifetime value prediction
Forecasts the total revenue a customer will generate over their lifetime, calculated from early behavioral signals.
Signals used
First 7-day engagement depth, initial purchase value and category, feature adoption speed, support history, community engagement, referral behavior, and campaign response.
Output
Predicted LTV at 6, 12, and 24 months, an LTV tier, a growth potential score, and an investment recommendation.
In campaigns
High predicted LTV unlocks premium onboarding and VIP treatment. Medium gets standard nurture plus upsell. Low runs on efficient automation only. Example: a new user engages deeply in 3 days and spends $50, so predicted 12-month LTV is $850 and a VIP onboarding journey fires.
Accuracy
71% accuracy on LTV prediction at 6 months.
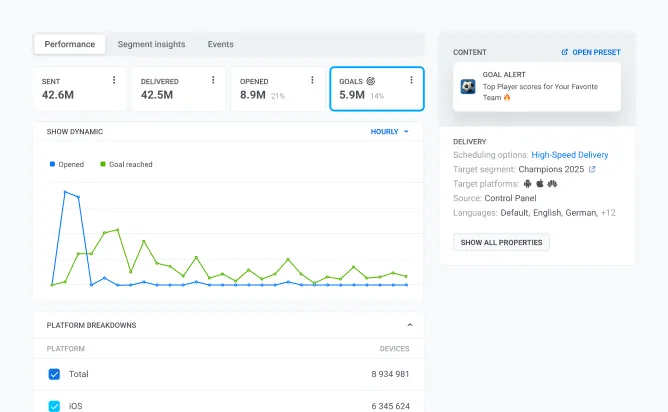
Next best action prediction
Determines the optimal next marketing action for each customer based on their current state and predicted behavior.
Factors considered
Current engagement state, recent interactions, campaign history and response, predicted next behavior, available offers, and channel preferences.
Output
Recommended campaign type, channel, timing, offer, and an expected impact score.
Example decisions
A user showing churn signals who just rejected a discount gets a feature-highlight campaign, not another discount. A high-probability user with items in cart gets an urgency push. A low-engagement user who responded to social proof before gets a community email.
See it all come together on the Pushwoosh analytics platform.
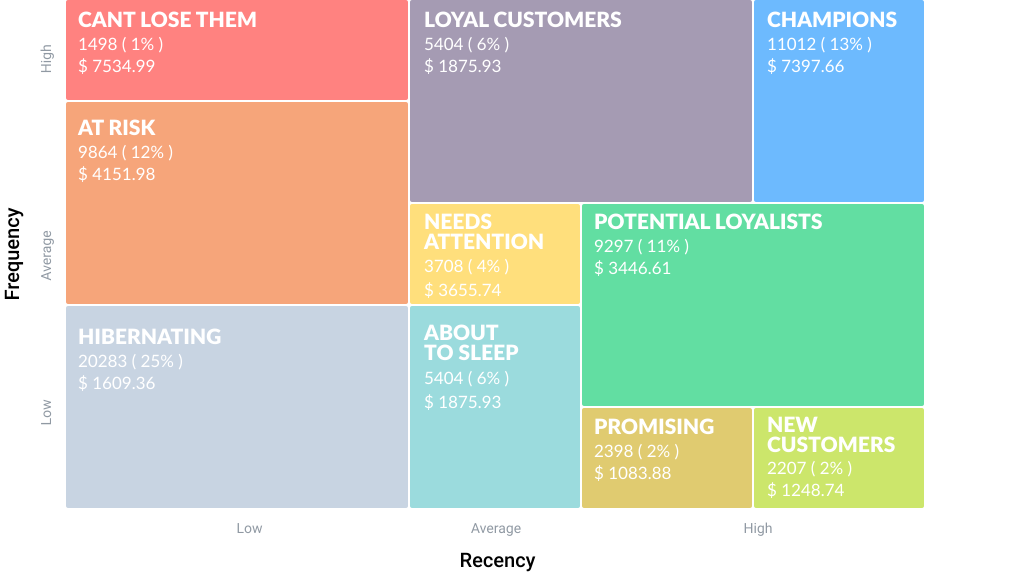
Product recommendation
Predicts which products, features, or content each user is most likely to engage with or buy.
Signals used
Purchase history, browse and view history, similar-user behavior (collaborative filtering), category affinity, price sensitivity, and seasonal patterns.
Output
Ranked recommendations per user, a confidence score per recommendation, and the best channel to deliver it.
Examples
Bought running shoes, so recommend running socks, a GPS watch, and protein bars. Watches horror movies, so recommend a new horror release and similar directors. Plays strategy games, so recommend related titles, expansion packs, and competitive events.
Impact
35% to 45% higher click-through on predicted recommendations versus manual curation.
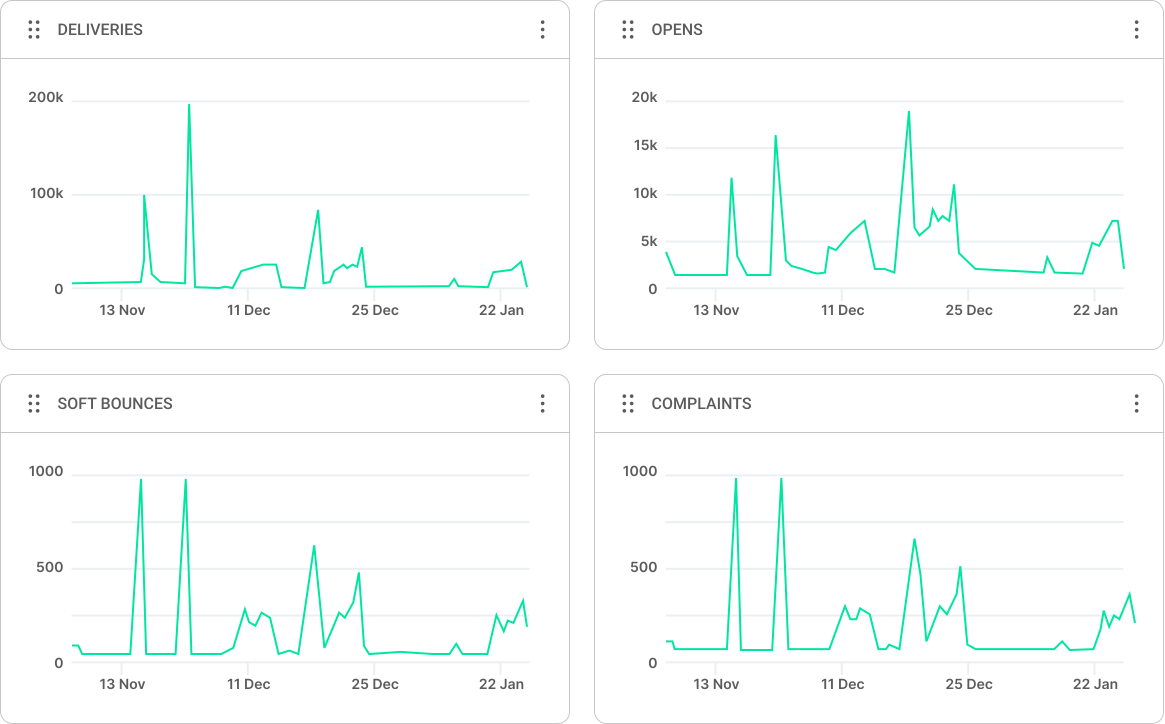
Send time optimization
Predicts the optimal time to send each message to each individual user for maximum engagement.
Signals used
Individual engagement history by hour and day, device usage patterns, response times, historical open and click times, plus timezone and location.
Output
An optimal send window per user, a confidence score, and alternative windows if the primary one is missed.
Examples
User A opens email between 7 and 8 AM on weekdays, so a Tuesday send is scheduled at 7:15 AM. User B opens on Saturday afternoons, so the message is held until Saturday 2 PM even if the campaign sends Monday.
Impact
18% to 25% higher engagement versus a single send time.
Machine learning without the data science team
Connect your data and models start working automatically. Predictions are available in 24 to 48 hours, with no manual feature selection and no tuning.
-
Data collection and unification
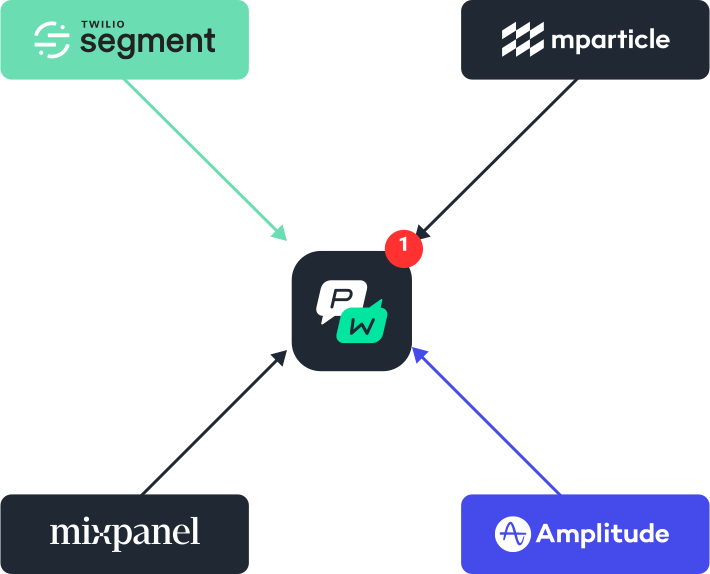
Behavior events, campaign interactions, customer attributes, transactions, and support history flow in through the Pushwoosh SDK, API, CRM, and data warehouse connections. Over 100 behavioral signals per user feed the models automatically. Unify it all in the customer data platform.
-
Model training
Models train on your historical data, learning the patterns that separate churned from retained and converters from non-converters. A minimum of 1,000 customers gets basic models running, while 10,000 or more and 90 days of history improve accuracy. No configuration needed.
-
Score generation
Every customer is scored in real time, and scores update as behavior changes. When a customer logs in after 14 days away, their churn score recalculates immediately from 85 to 42. Scores are available in segmentation, via API, through webhook triggers, and as exports to your CRM or warehouse.
-
Campaign integration
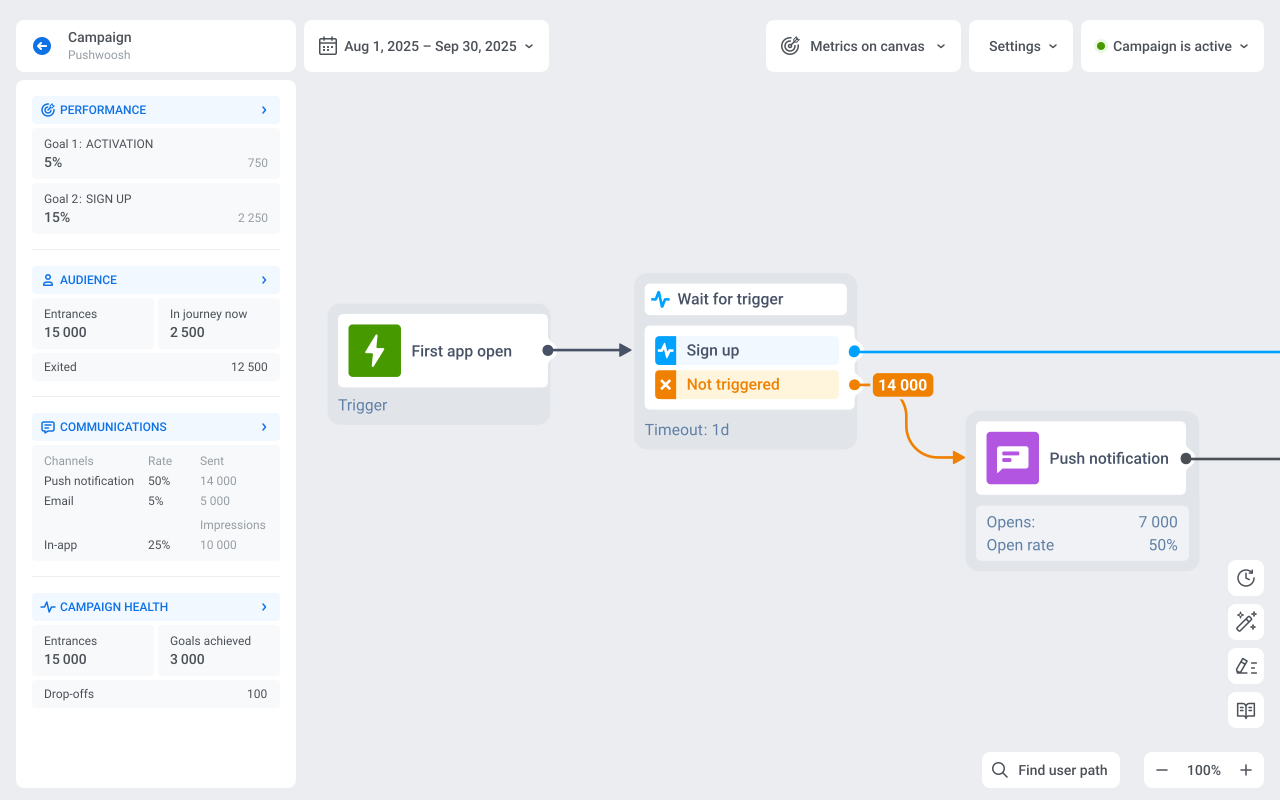
Segment by score ranges, trigger campaigns when a score crosses a threshold, and personalize content and offers by predicted value. For example, churn risk above 70 triggers retention, conversion probability above 80 triggers an urgency push, and a high LTV tier triggers VIP onboarding.
-
Measure and improve
Track prediction accuracy, false positive and negative rates, campaign impact, and model drift over time. Models retrain weekly on new data and campaign outcomes feed back in. A model-driven retention campaign saves 60% of at-risk users versus 28% for the manual approach.
Predictive analytics for your industry
The same models adapt to the signals and outcomes that matter in your vertical.
Predict the next purchase date, separate price-sensitive from brand-loyal customers, forecast seasonal demand per customer, score browse-to-buy readiness, and flag return likelihood after purchase.
Example: an email sent 3 days before the predicted purchase date lifts conversion 35%.
Predict whale conversion from early behavior, forecast player churn by game stage, identify players ready for an in-app purchase offer, predict tournament participation, and score daily active user risk.
Example: whale prediction in the first 48 hours delivers 45% higher VIP treatment ROI.
Predict feature adoption likelihood, forecast trial-to-paid conversion, score expansion-revenue readiness, identify churn 60 days early, and predict support ticket likelihood.
Example: churn prediction 60 days early gives customer success 3x more time to intervene.
Predict renewal likelihood, forecast upgrade readiness, identify downgrade risk before it happens, score pause versus cancel likelihood, and predict referral potential.
Example: a downgrade risk score plus a preemptive offer keeps 22% of at-risk subscribers on their full plan.
Predict contract non-renewal, forecast upgrade readiness, identify competitor switching risk, score plan optimization opportunities, and predict device upgrade timing.
Example: a competitor switch model flags 15,000 at-risk subscribers and a retention campaign saves 60%.
Predict appointment no-shows, forecast preventive care gaps, score patient engagement risk, predict medication adherence, and identify wellness visit opportunities.
Example: no-show prediction plus proactive reminders to high-risk patients cuts no-shows 40%.
Segments that update themselves
Predictive scores power dynamic segments that add and remove users automatically as behavior changes. Build them in the customer data platform.
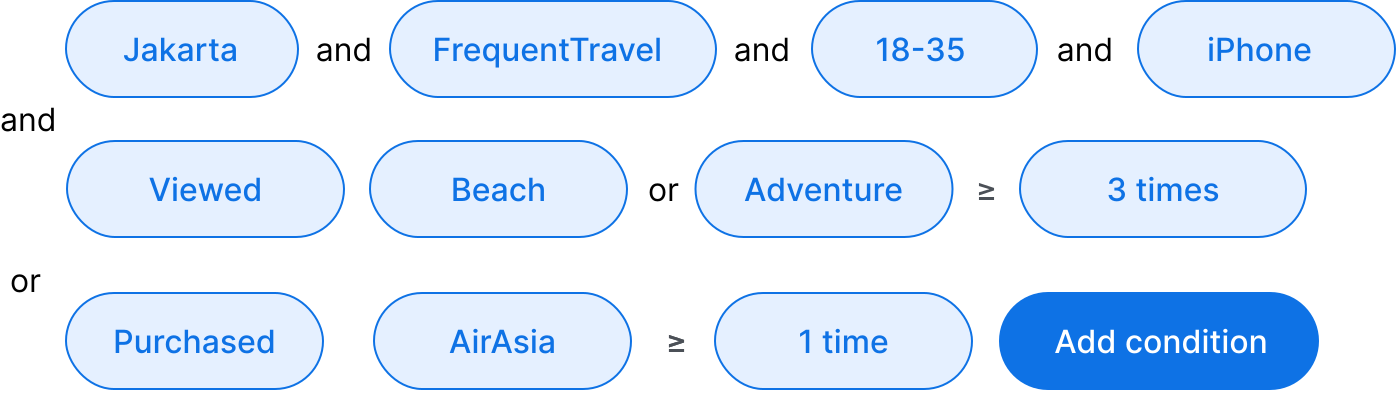
Five segments, zero manual upkeep
- About to churn
Churn score above 70 in the last 7 days. Enters a retention campaign, exits when the score drops below 50. - Ready to convert
Conversion score above 75, updated hourly. Triggers within an hour because scores decay in 24 to 48 hours. - Future VIPs
New users with predicted LTV in the top 20%. Triggers a VIP onboarding journey, with actual versus predicted LTV tracked over time. - Reactivation ready
Lapsed users with a reactivation score above 60. Triggers a win-back sequence timed to each user’s score peak. - Upgrade ready
Active users with an upgrade score above 65. Triggers a targeted offer that converts 28% versus 8% for a blanket campaign.
Launch predictive models in days
From connecting data to a live predictive campaign in under two weeks.
-
Day 1 to 3: connect your data
Install the Pushwoosh SDK, configure event tracking for key behaviors, and optionally connect your CRM and data warehouse. Tracking just 3 events (session, purchase, cancel) generates enough data for basic churn and conversion models.
-
Day 3 to 7: models train automatically
The platform ingests historical data and models train on your customer patterns. First scores appear within 24 to 48 hours, and a model accuracy report showing around 82% precision is available by day 7.
-
Week 2: launch your first predictive campaign
Start with the high churn risk segment (score above 70) and a retention campaign across push and email, measured against a control group. The first campaign typically saves 60% of high-risk users versus 25% for the control.
-
Month 1 and beyond: expand to more models
Add conversion and upgrade campaigns, then LTV and VIP segmentation, then recommendations and full next best action automation. Expect measurable churn reduction by month 1 and a 30% to 50% improvement in key metrics by month 6.
Start predicting customer behavior
See how predictive analytics surfaces churn risk, conversion opportunities, and high-value customers automatically. Request a demo and see your data through a predictive lens.
Explore related products
Your fully autonomous AI marketing copilot, grinding and earning 24/7. Revenue-obsessed AI that catches performance leaks and optimizes campaigns.
Customer engagement platform with AI personalization. Deliver hyper-relevant content, dynamic offers, and personalized journeys that convert.
One MCP server, every channel — push, email, SMS, WhatsApp, Telegram, LINE, Kakao. Add the endpoint to your AI client, hand your agent two tools, ship.
From sports updates to breaking news to weather alerts and travel updates, seconds can make a huge difference. Our powerful High-Speed Delivery technology allows sending up to 500,000 push notifications per second!
In-app messaging by Pushwoosh — onboard, upsell, announce and collect feedback right when app users are paying attention. No-code editor, native SDK layouts, per-element analytics. Free to start.
Mobile push notifications by Pushwoosh — every-device reach, rich content, precise targeting, cross-channel Journeys and 99% uptime. Turn notifications into loyal, paying users.