As a manager in charge of an app’s communications, you are likely to keep track of the messaging performance and report on it regularly to senior management. You may wish that your target metrics were gathered conveniently all in one place, and all you had to do was take a screenshot and add it to your slides. Well, this is exactly what you can now do with a new statistics report in Pushwoosh. It is called Project Overview, and it presents the key numbers in a comprehensive, visually appealing form. In this blog post, we’ll tell you what insights you can gain from the new report and how to use it for maximum efficiency.
Gain insight into your audience’s growth trends
Check the key metrics at a glance:
- your total user base (Total Subscribers)
- the number of users subscribed to your communications on at least one channel (Subscribed Users)
- the number of users opted-in for your push notifications (Recipients)
In bold, you can see the number for a given date; hover over the light-blue charts to see how it has been evolving in the past seven days. This extra information lets you stay alert to any abrupt changes in your audience numbers.
Imagine there is a sharp fall in the number of your Recipients — this is a surefire sign that something has gone wrong in your most recent campaign, so a significant part of users preferred to opt out. Or there was a technical mistake, and you’d better go to Support to investigate and take action.
 🔔Don’t
like your number of Recipients? Then, take steps to get more users to opt in for
your push notifications —
read our recommendations.
🔔Don’t
like your number of Recipients? Then, take steps to get more users to opt in for
your push notifications —
read our recommendations.
Evaluate your app’s health by DAU & MAU trends
Besides your audience metrics, you can get the most up-to-date numbers of daily and monthly active users. Similarly, you will also see the absolute numbers and the trend for the previous periods.
As you well know, DAU and MAU are the most illustrative when you see them in dynamics. Our charts can provide you with such insight.
Furthermore, these additional graphs can help you quickly discover which days/months your audience was the most active. Thus, if you pushed any exciting news or offers a couple of days ago, and the audience headed to your app afterwards, you may immediately see a spike and make a conclusion on your communication effectiveness.
 📈Benchmark
your numbers of DAU and MAU against your industry medians and get
recommendations on how to boost the metrics. Read our dedicated post about
DAU
and
MAU.
📈Benchmark
your numbers of DAU and MAU against your industry medians and get
recommendations on how to boost the metrics. Read our dedicated post about
DAU
and
MAU.
Get per-platform statistics for all the metrics
The greatest thing about the new report is that you can get an overview of your messaging effectiveness for a specific platform. Once you’ve filtered out the platforms you’re the most interested in (in the example below, we chose iOS and Android), all the presented metrics will be recalculated for the selected platforms only.
By doing so, you can prepare side-by-side comparative reports on your app’s performance on different platforms. For example, it may be insightful to see with your own eyes how the number of opted-in users and Average CTRs vary on iOS and Android.
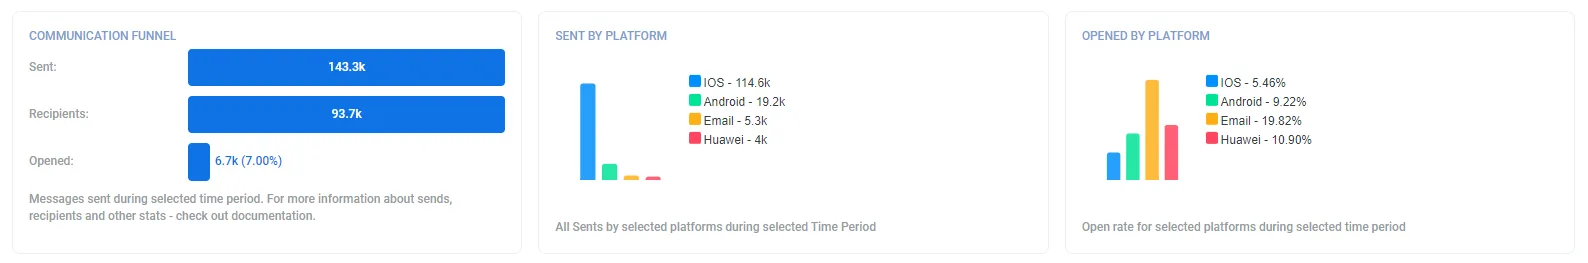
Break down your communication funnel
You can now track your messages’ journey from the messages being sent to received to opened. The aggregated statistics are displayed as the percentage so that you can get an at-a-glance understanding of your overall communication performance.
And you can dive deeper into analytics as the numbers of Sent and Opened messages are broken down per platform!
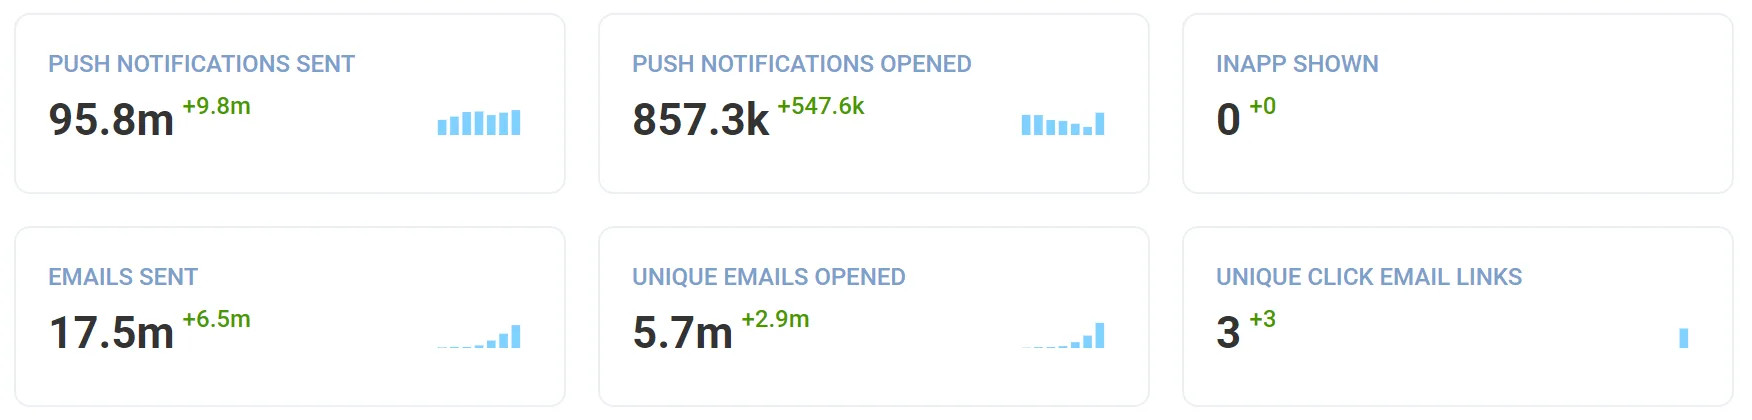
Monitor your messaging statistics across the channels
Get total numbers for how many messages were sent (or shown), opened, and clicked on. These include stats for the three channels you are most likely to use in Pushwoosh: push notifications, in-app messages, and emails.
An unrivaled feature: for emails, the numbers reflect unique opens and clicks. This allows you to see an accurate picture of your email campaigns’ engagement. Other messaging platforms might not provide such statistics, which is a shame because it misleads their customers.
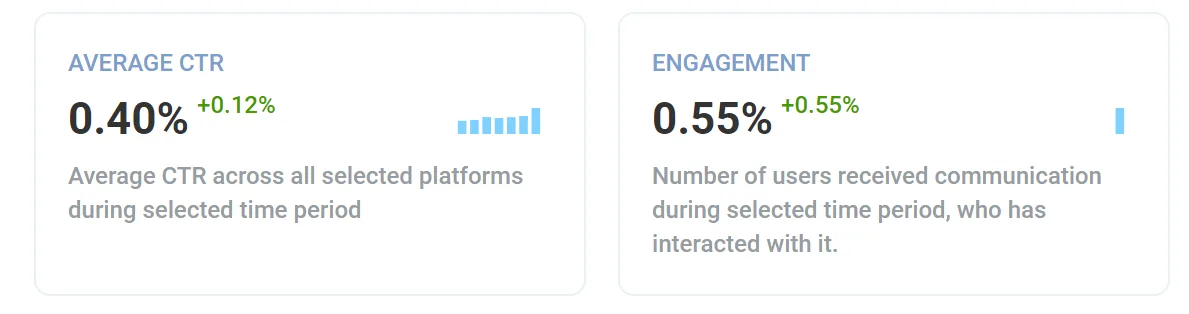
Assess your user engagement efforts by two essential metrics
As a push notification sender, you may care the most about your push notifications’ Average CTR, and it’s calculated for you in our Project Overview report. You may use the metric to determine if the content and targeting of your push campaigns were on-point.
In addition, you may want to research the percentage of users that have engaged with at least one message you sent them during your selected period. We call it Engagement in the new report, and it is the same as what we previously called User CTR in our data studies of the game apps industry and the LATAM region.
We recommend tracking Engagement to assess the activeness of your audience. For instance, do users ever react to your communications? If not, is it because your messages are irrelevant or your audience is inactive? You will find it out.
 👍Break
down more
metrics that define your push notification campaign effectiveness.
👍Break
down more
metrics that define your push notification campaign effectiveness.
Gather statistics for any date range
All the metrics we talked about above can be displayed for your chosen period:
- By default, you can check the stats specifically for today, yesterday, this/previous week or this/previous month;
- You can also manually select a date range.
Thanks to this, you can use the Project Overview report for two purposes:to keep track of the critical metrics day by day and to conduct periodic analysis to report on your weekly, monthly or quarterly performance.
💾Are you interested in learning more about data retention periods in Pushwoosh? Then, refer to this blog post.
What happens to other reports in the Pushwoosh Statistics section?
If you’re used to monitoring your metrics with the good old Channels and Audience reports, no worries: they will stay in the tool in the Statistics section.
However, if you’re excited about everything new, including how we present metrics in Pushwoosh, stay tuned as we’re working on some more reports.
Learn more about every metric and chart we display in the new statistics report from our documentation. Or go ahead and get your own Project Overview:
Check your app statistics in the new report
Got questions on how to read the new report in Pushwoosh Statistics? Any feedback to share? Contact our Support team or discuss your ideas privately with your Customer Success Manager.